Chart
The Chart macro of the ADONIS Process Manager / ADOIT Enterprise Architect for Confluence enables you to display an ADONIS / ADOIT analysis model chart as an interactive image in Confluence.
With the Chart macro you can:
- Add an interactive analysis chart from ADONIS / ADOIT to Confluence
- Switch between the available views of that analysis
- Get a closer look at the parts of the chart you are interested in with zoom and drag and drop
- Get additional information on your chart's objects as tooltips by clicking on them (e.g. view the description of an object)
- Access the chart and its view in ADONIS / ADOIT from your Chart macro in Confluence
How to use the Chart macro
Configure macro
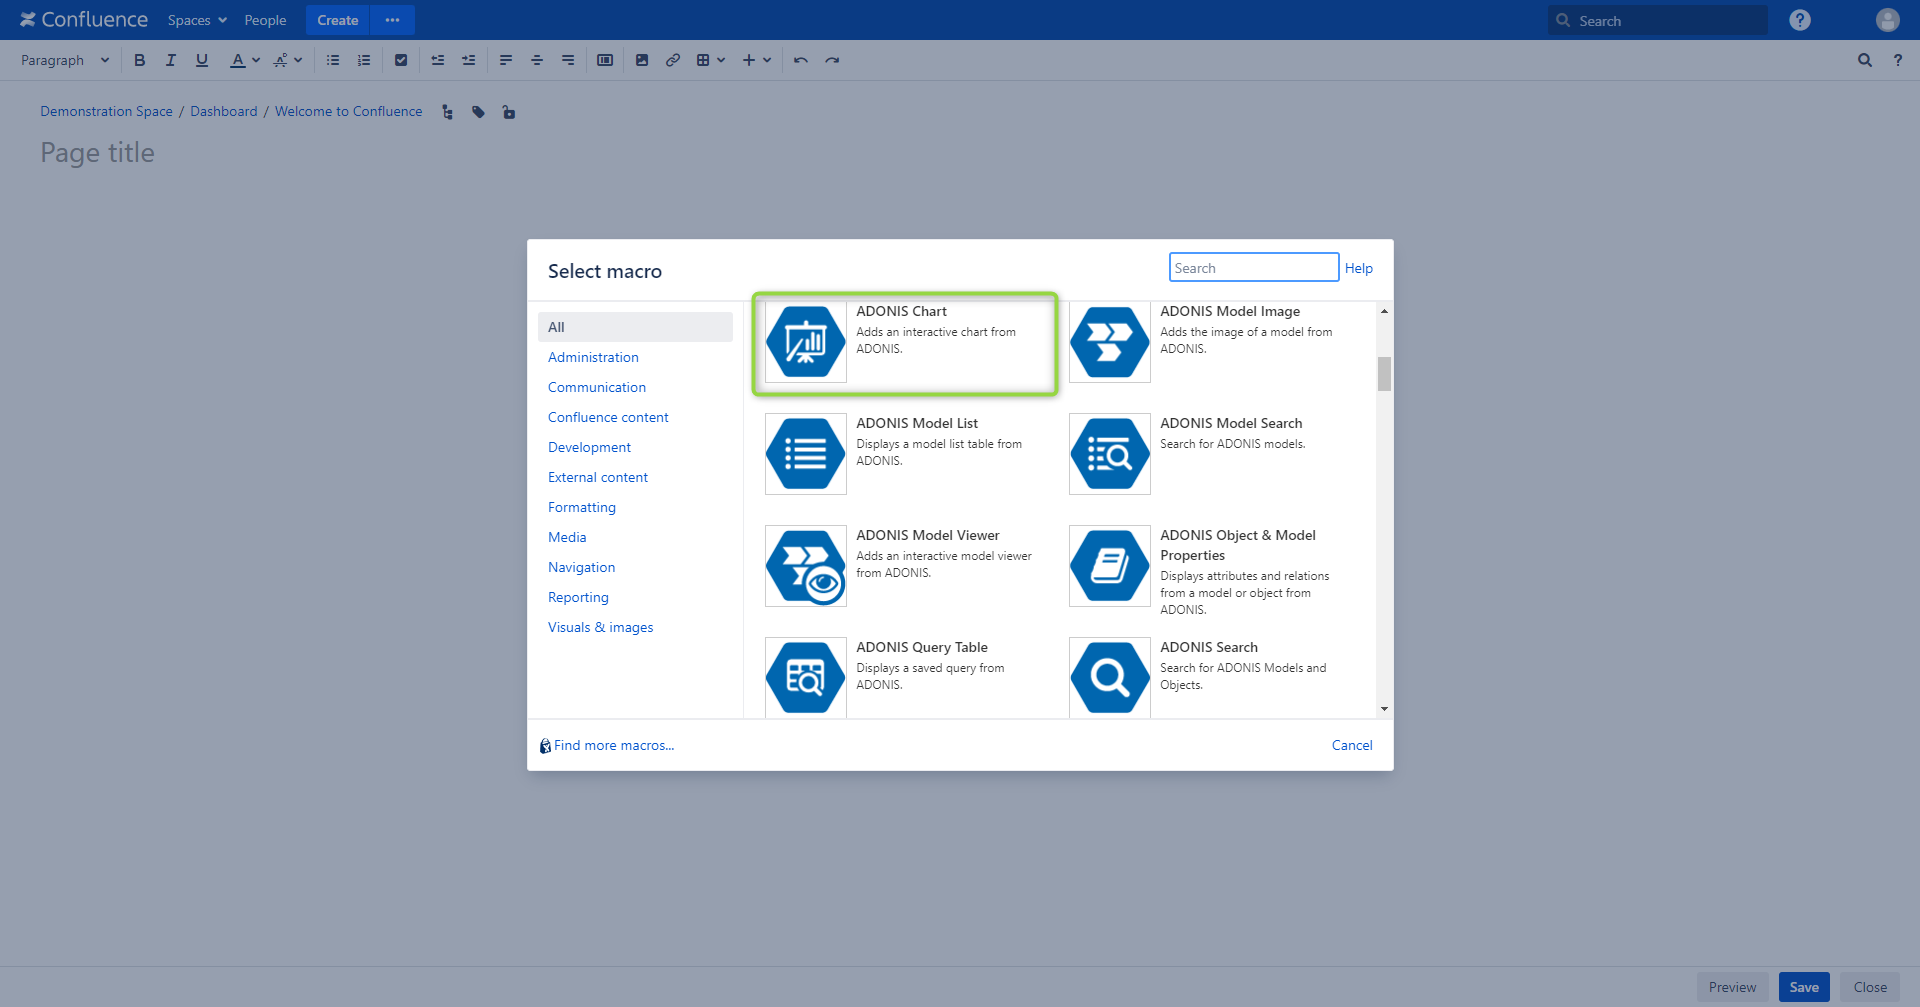
While editing a Confluence page, press Ctrl + Shift + A to open the macro selection dialogue. Search for the ADONIS/ ADOIT Chart macro and click on it.

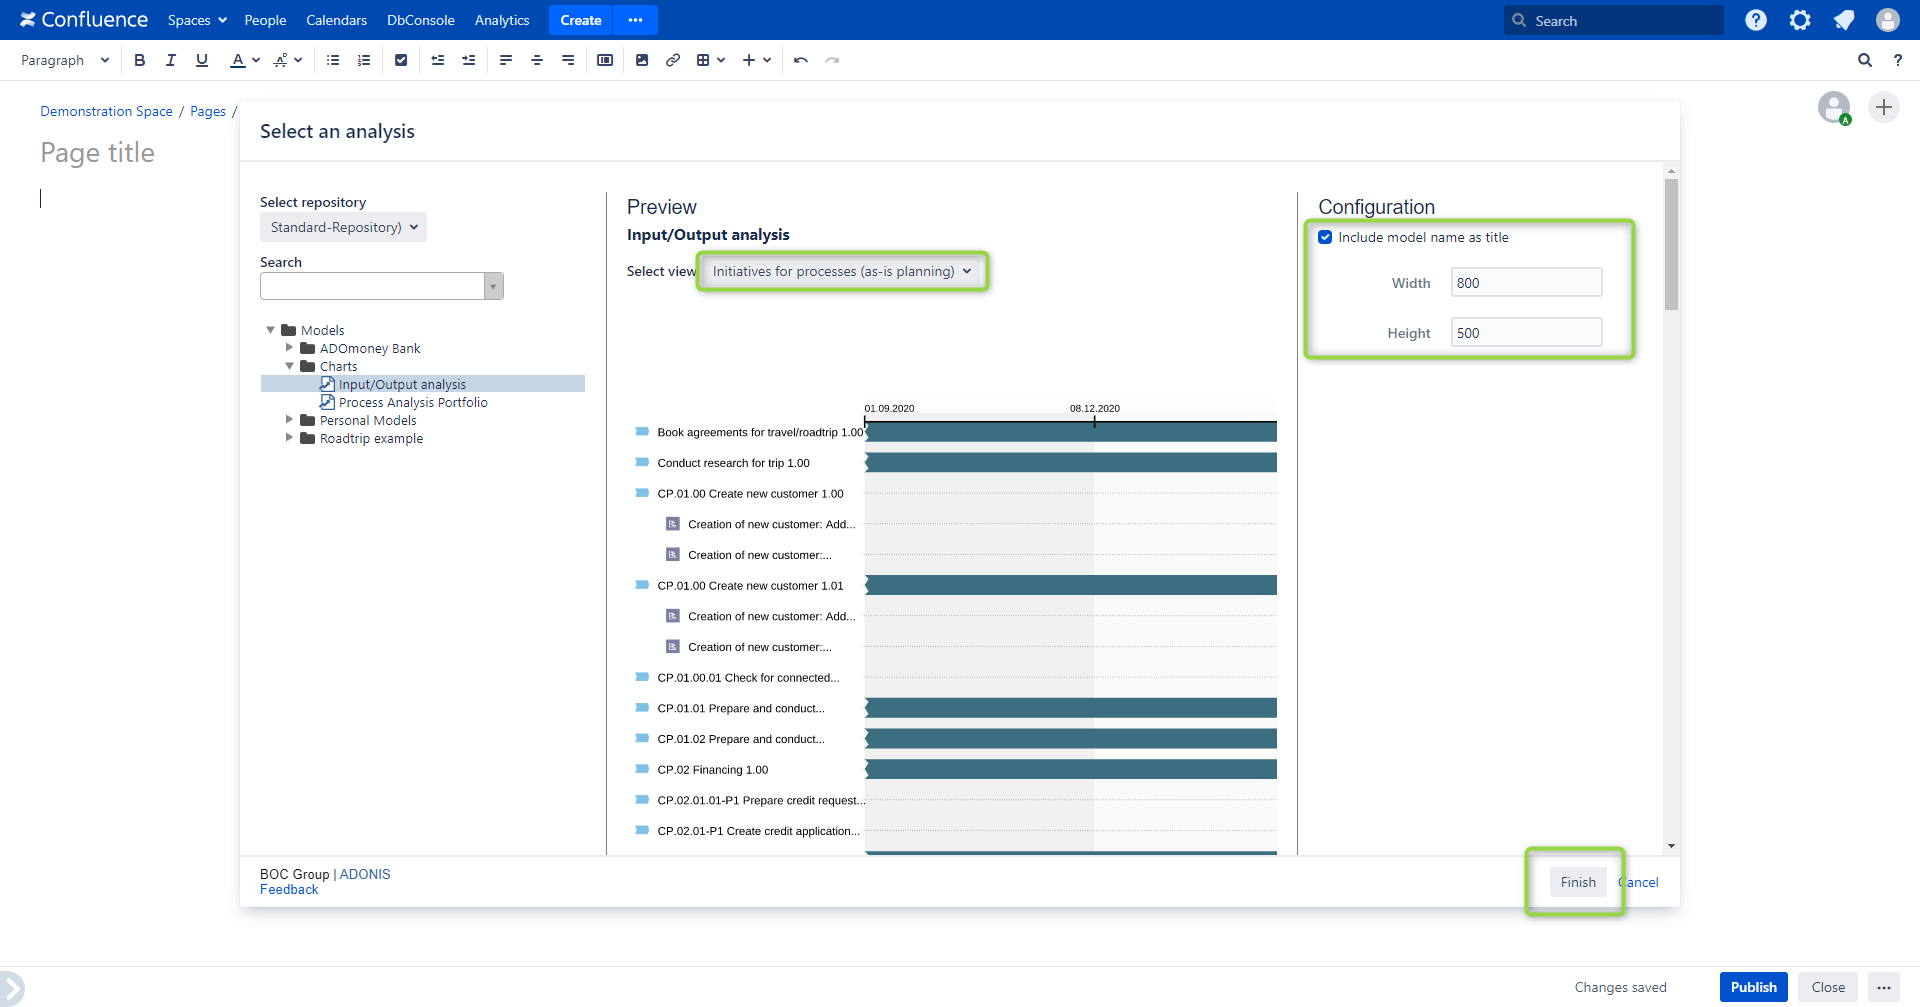
A configuration dialogue opens. Here you can search for your analysis model, or select it in the explorer view on the left of the configuration dialogue. In the center you can see a chart preview based on the selected view at the top.
After selecting the chart, you can define the visualization details of your chart.
If you don't want to show the name of your analysis and chart above the macro, clear the "Include model name as title" check box.
You can define the width and height of the Chart macro in your Confluence page or else keep the default values.
When you are done configuring your chart, click "Finish". In case you want to change the visualization later, the chart configuration can be adjusted at any time while editing your Confluence page.

View options
With the Chart macro, you can display your chart as an interactive image on your Confluence page.
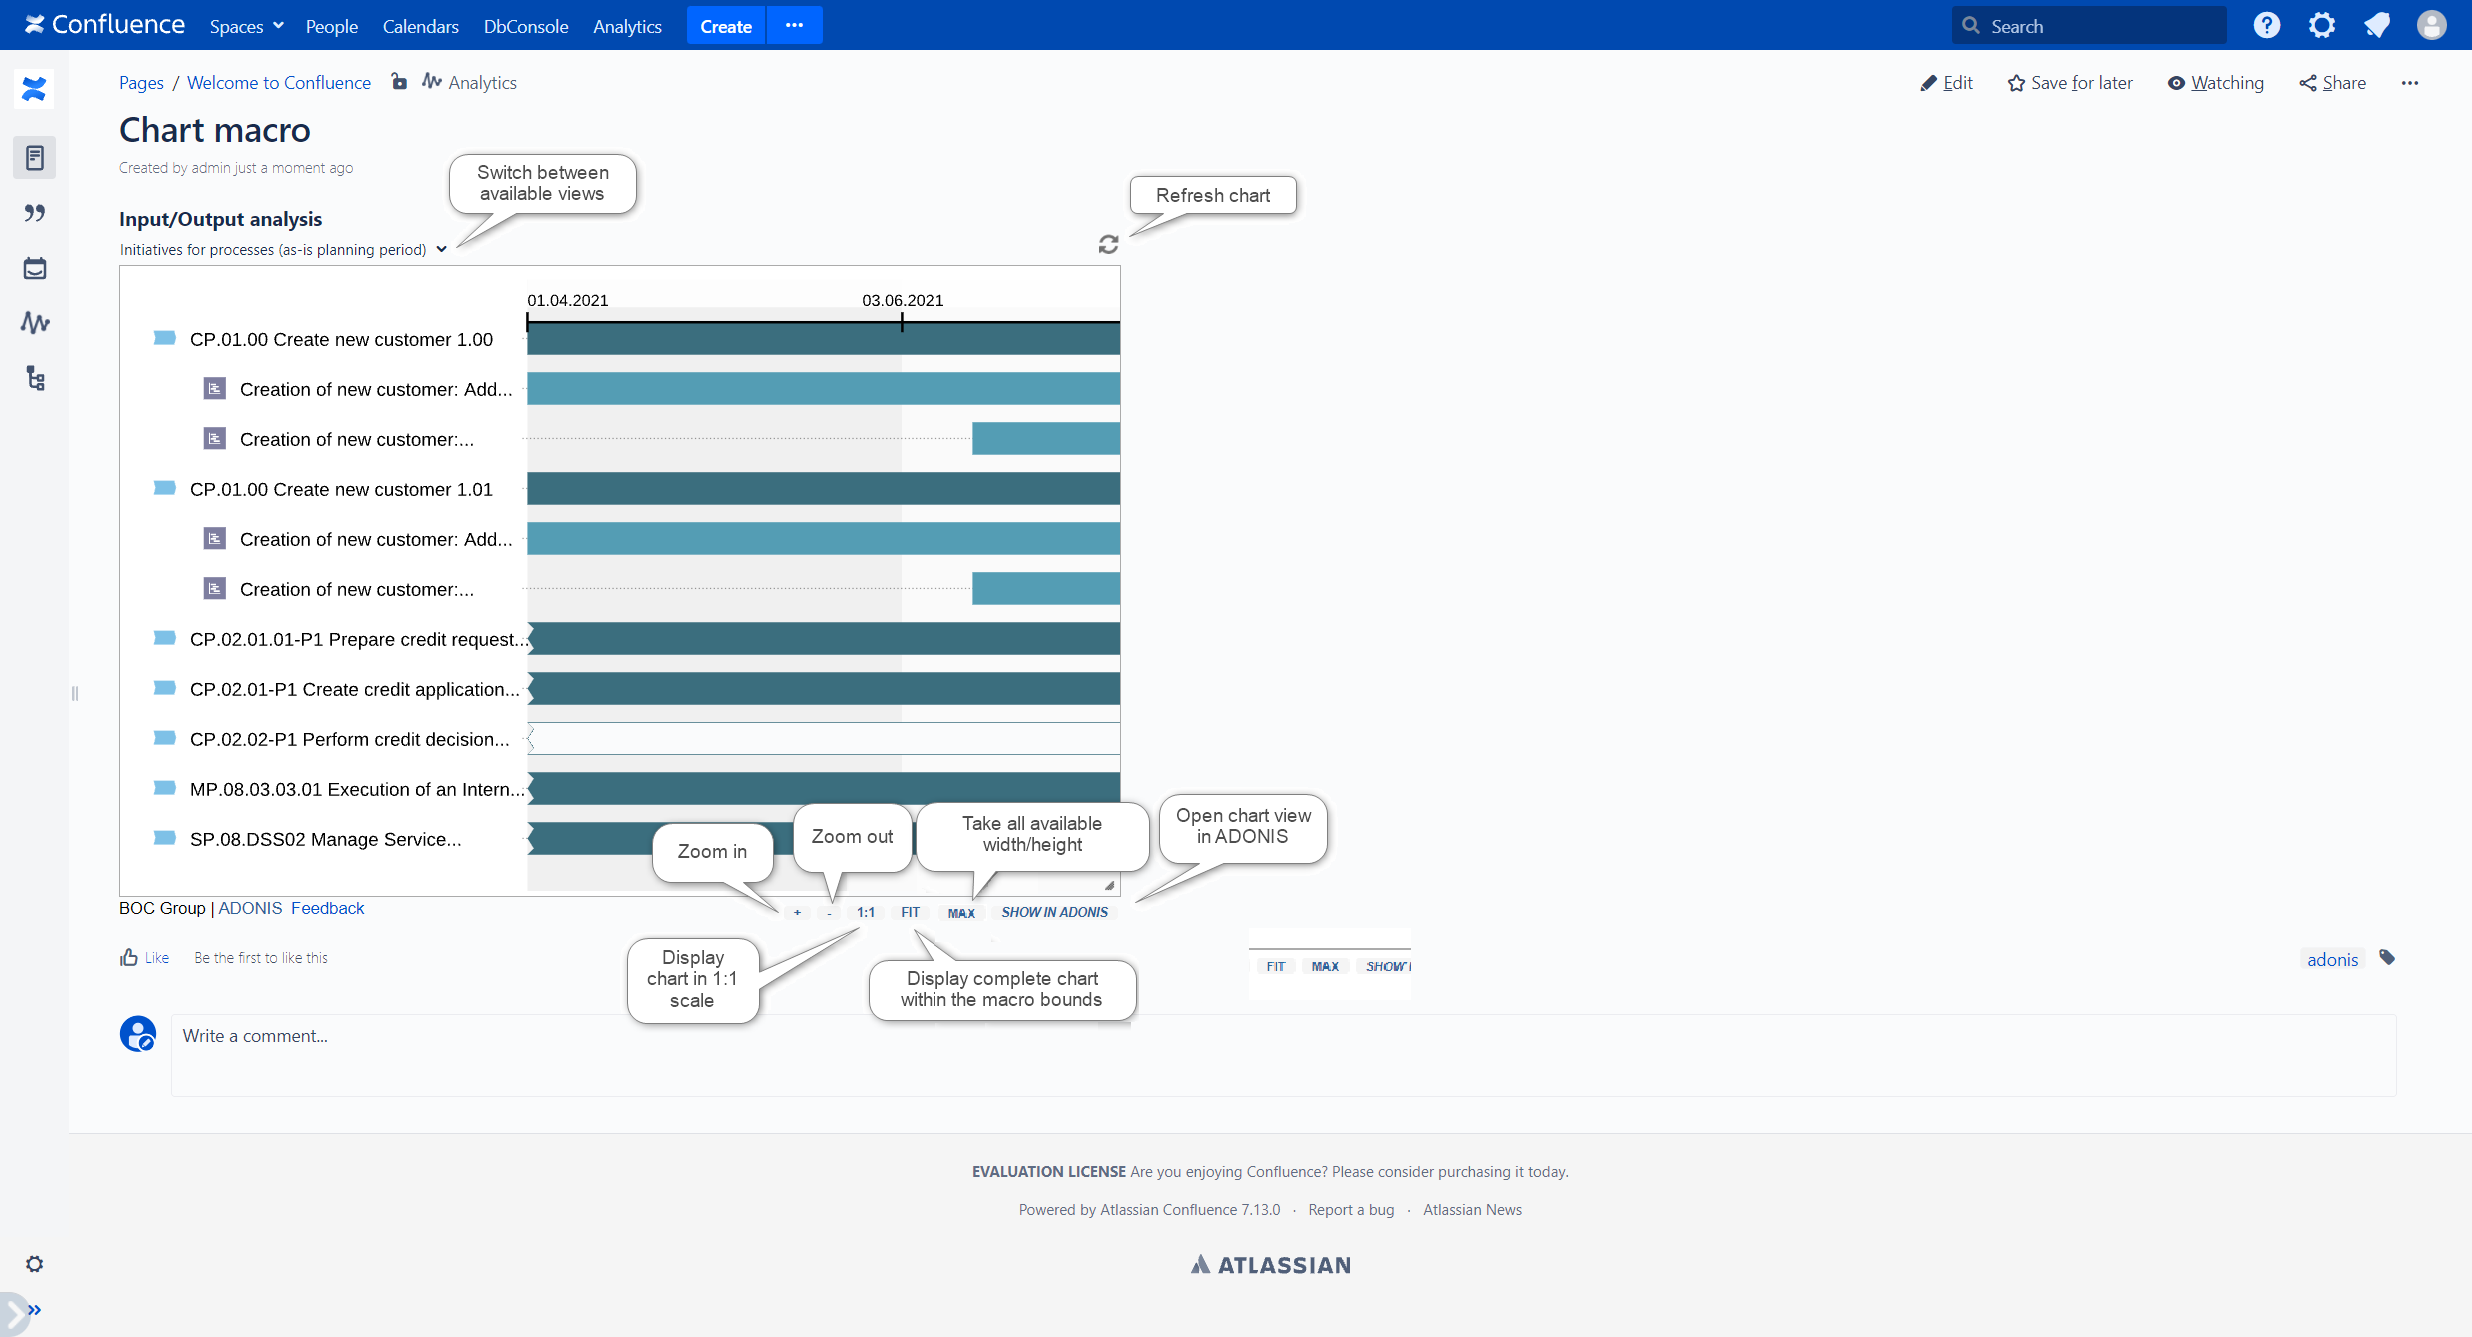
If multiple chart views are available, they can be switched with a dropdown right under the model name.
To zoom in/out of the view displayed in the chart, click the + and - buttons, or use Ctrl + Mouse up/down wheel.
To reset the zoom level of your chart, so that the complete chart can be seen within the Chart macro bounds, click the FIT button.
To display the chart view in 1:1 scale, click the 1:1 button.
To set the macro to use the width and height of the entire viewport, click the MAX button.
To open the corresponding analysis view in ADONIS / ADOIT, click the Show in ADONIS / ADOIT button on the right below the chart.
To refresh your chart manually to synchronize its content with your ADONIS / ADOIT instance, click the refresh button on the right above your chart.
To get additional information about the model's objects as tooltips, click on the objects.
