Why is my BOC product behaving slowly?
Problem: Long response times, poor performance
Some (or all) functions in your BOC product (ADONIS, ADOIT or ADOGRC) behave abnormally slowly and take a long time to complete:
Sometimes a BOC product seems to slow down over time. Under certain circumstances, peak workloads temporarily cause poor response times, which then normalize again. Ongoing maintenance work in your IT infrastructure can lead to temporarily slow response times. Permanent changes to your IT infrastructure can also lead to a deterioration in response times.
In order to improve poor response times, follow the solutions described below.
Solution 1: Update database statistics
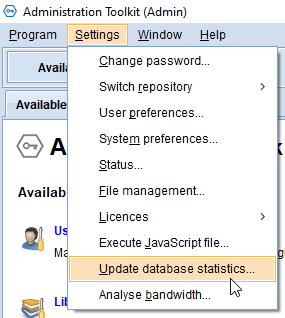
In the Administration Toolkit, from the Settings menu, run Update database statistics....
This feature optimizes access times to the database. The function not only updates the statistics about the data distribution, but also defragments the data in the database and rebuilds the relevant database indexes. In many cases, this measure leads to a significant improvement in the performance of BOC products.
Note:
- Updating the database statistics usually takes anywhere from a few seconds to 30 minutes or more, depending on the database size.
- While the database statistics are being updated, the response times for other users can temporarily deteriorate further because the update process creates additional load on the database system. It is recommended to update database statistics at a time when few users are using your BOC product.
- It is recommended to update database statistics via the Administration Toolkit at least once a week.
This video shows how to update database statistics:
Solution 2: Wait for external events to end
External events over which you have no influence could slow down the system temporarily: Maintenance work may be carried out in your IT infrastructure (without your knowledge), or peak workloads in other software products may slow down the system. There may also be other temporary events that have an impact.
Note: If you use a BOC product from the BOC Cloud (SaaS), maintenance activities carried out by BOC are always announced in advance by email (unless short-term emergency maintenance is required).
Therefore, wait some time until any maintenance work (or other events) can be completed. This is usually the case within a few hours, but it can also take up to the next working day. If necessary, contact your IT team to be informed about ongoing maintenance activities.
If poor response times are due to IT maintenance activities or other temporary events, response times will go back to normal after these events are over. In this case, no further action is required.
Solution 3: Restart services
You can only use this approach if your BOC product is installed in your own infrastructure (on premise). If you use a BOC product from the BOC Cloud (SaaS), BOC will carry out the necessary steps as required.
In rare cases, internal domino effects of load-intensive and blocking actions can lead to deterioration of response times. This can be fixed by restarting the services of the BOC product.
Stop all services of the BOC product and then restart them:
- The Application Server Service
- And the Web Server Service
Then wait a few minutes (up to 1 hour or more for very large scenarios) until the services have been successfully started and initialized.
Important: Note that a service restart will end all ongoing user sessions without allowing users to save their latest changes. During a restart no user can access the BOC product. It is therefore recommended to only perform a restart in a maintenance window.
Solution 4: Identify relevant system changes
The response times of your BOC product were most likely fine at an earlier point in time. So ask yourself: What has changed that could be the trigger for the slower response times?
Typical changes that can cause performance problems include:
Changes to your IT infrastructure (updating hardware or software components, changing the network configuration, server changes, etc.).
Activation of new interfaces to third-party systems.
Workshops, training courses and other events at which much more users access the BOC product than usual.
Points in time with unusually high workloads (e.g. peak loads at the end of the quarter).
New locations, e.g. access from home office instead from the usual company location.
Updating the version or configuration of your BOC product.
Migration of components of your BOC product to a new infrastructure (e.g. to other servers).
Other changes.
Once you have identified the relevant change, consider whether it is temporary or whether you can reverse it.
You may also find that your system is not adequately dimensioned for peak loads. In this case increase available system resources.
Solution 5: Check REST API usage
Have you integrated an external system with your BOC product and are you using the REST-API from ADONIS, ADOIT or ADOGRC?
If yes, make sure that the number of REST queries per hour does not exceed the recommended maximum value. Perform data updates with intensive REST communication at off-peak times when only few users access the system. If necessary, reduce the number of REST queries.
If your REST implementation seems to require too many REST queries, contact your BOC customer account manager. It may be possible to find a more efficient implementation with the help of our solution teams.
Solution 6: Check network
Check the speed and bandwidth of the network connection between application server and database server, as well as between other components of your product installation. Compare the current network performance to the requirements of your BOC product:
Network connection between application server and database server
Network Speed:
A round-trip-time (RTT) of <= 1ms is recommended between the application server and database server.
A round-trip-time (RTT) of at least <= 3ms is required between the application server and the database server.
Bandwidth:
To check the available bandwidth, start the Administration Toolkit on the same computer where the application server of your BOC product is running. Then select the menu item Settings > Analyse bandwidth... and start the bandwidth test.
The result shows reference values for optimal response times, as well as your current values. If your current values are a little above optimal values, this is usually not a problem. However, if in many categories your current values are multiples of the optimal values, then your network bandwidth or latency could be the cause of slow response times. If in doubt, contact BOC technical support for an evaluation of the bandwidth test results.
Network connection between client and web server
A slow or unstable network connection between client and web server can for example slow down the following use cases:
- Opening the URL to your BOC product. Duration until the login mask appears.
- Opening the notebook of an object. Duration until all data is fully loaded and displayed in the notebook.
- Duration of access to the REST API of your BOC product.
Ensure a stable network connection that meets the bandwidth requirements of your BOC product. Keep in mind that a wifi connection from home office or from on the go often shows higher latencies and less stability than the LAN connection at a company location.
Identify packet loss:
On the web server, open the directory in which the log files of the web server are located. By default, this is the directory "<Apache Tomcat installation directory>\logs".
In the log directory, identify the file "<product>_Core.log" (e.g. "ADONIS15.0.0_Core.log").
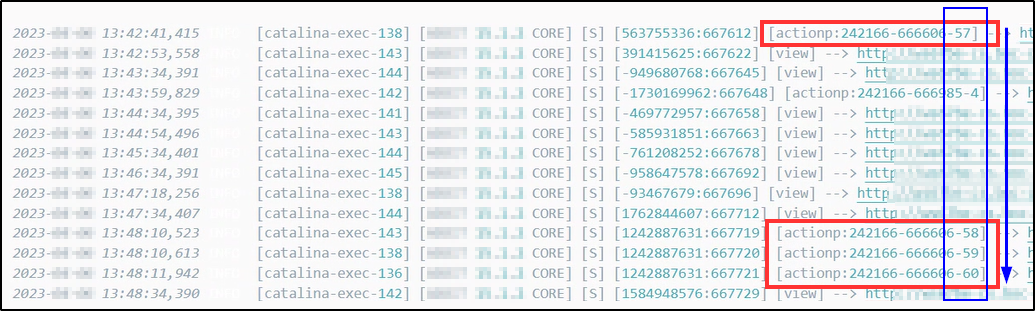
Open this log file in a text editor and search for the following keywords around the time of the performance problems: "action:", "actionp:", "webmethod:".
These keywords are usually followed by three numbers, such as "actionp:242166-666606-57". The last number (here "57") is the consecutive number of the request. This number always and continuously increases as long as the two leading numbers remain the same (see figure). If there are gaps in the sequence of numbers, then this indicates that the corresponding requests were not received by the web server. In isolated cases this can happen from time to time, but if it occurs repeatedly then contact your IT team to improve network stability or consider access from a different location or network.
Solution 7: Delete old data
Delete no longer needed data, such as old models, objects or repositories.
Be sure to update the database statistics after deleting large amounts of data!
Important: It is strongly recommended to create a backup of the database before deleting any data.
Solution 8: Check database utilization
You can only use this approach if your BOC product is installed in your own infrastructure (on premise). If you use a BOC product from the BOC Cloud (SaaS), BOC will carry out the necessary steps as required.
Contact your database team and have the workload on the database server checked at a time when the slow response times in your BOC product are actually occurring.
If the database or the database server is overloaded, your database team can usually fix this with configuration adjustments.
Solution 9: Increase system resources
You can only use this approach if your BOC product is installed in your own infrastructure (on premise). If you use a BOC product from the BOC Cloud (SaaS), BOC will carry out the necessary steps as required.
Check the utilization of the most important system resources on the web server, on the application server and on the database server of your BOC product:
- CPU
- RAM (memory)
- Network
- Maximum size of the Java memory of the web server: If necessary, increase the "Maximum memory pool" of your Apache Tomcat installation. Before doing this, however, make sure that the web server has sufficient physical memory (RAM) to be able to supply the increased "Maximum memory pool". For small and medium-sized scenarios, a "Maximum memory pool" of 2048 MB is usually sufficient. Much higher values may be required for large scenarios.
Increase system resources that are under heavy load.
Keep in mind that more system resources are required for punctual peak loads than for normal loads.
Also make sure that your infrastructure meets the system requirements of the BOC Management Office. You can find the minimum system requirements in the description of Hardware/Software Requirements of your product:
Solution 10: Identify affected users
Determine if all or just some users are affected by the degradation in response times. If only certain users are affected, consider what makes them different from the other (unaffected) users:
Are only users with specific use cases affected? (e.g. only users who generate certain reports, etc.)
Are only users from certain geographic locations affected?
Are only users accessing at certain times affected?
Once you have identified the relevant difference between affected and unaffected users, this will likely point to the resolution of the performance issue.
Solution 11: Check logs
You can only use this approach if your BOC product is installed in your own infrastructure (on premise). If you use a BOC product from the BOC Cloud (SaaS), BOC will carry out the necessary steps as required.
On the application server, open the directory in which the log files of your BOC product are located. By default, this is the directory "<BOC installation directory>\logs".
In the log directory, identify the files with the following names and a timestamp that matches the time of your performance problems:
- "<timestamp>_aworker.log"
- "<timestamp>_aserver.log"
Open these log files in a text editor and look for the following entries around the time of the performance problems:
| File | Log entry | Meaning |
|---|---|---|
| ...aworker.log | "[WARN] Performance issue: m_pDataSource" | This entry indicates slow responses from the database system. This can be due to an overload of the database server or because of a slow network connection between the application server and the database server. Check the database workload, and the network speed. |
| ...aserver.log | "The process memory working-set value is above the warning threshold" | This entry indicates that your BOC product is using an unexpected amount of memory. Check whether there is enough free main memory (RAM) on the application server and increase the available RAM if necessary. If indeed enough RAM is available and this log entry is still shown, contact BOC technical support for a deeper analysis. |
| ...aserver.log | "memory is below the warning threshold" | This entry shows that there is not enough free main memory (RAM) available on the application server. Increase RAM on the server. |
| ...aserver.log | "System memory status" | This entry shows how much main memory (RAM) was available at the time of the log entry, both in total and free. For example, the full entry might look like this: "System memory status (total / available): 16383 MB / 543 MB" - If there is little memory available (less than 2 GB or less than 10% of total memory), increase it the available RAM on the server. |
| ...aserver.log | "phys-avail" | This entry is part of a longer log line that provides information about the memory usage at the time of the log entry. For example, the full entry might look like this: "working-set: 1005MB working-set-max: 1012MB paged-current: 1281MB paged-max: 1368MB phys-avail: 2024MB virtual-avail: 123218028MB" - If the value after "phys-avail" is very small (less than 1GB), consider increasing the available RAM on the server. If the values are ambiguous, contact BOC technical support for a deeper analysis. |
| All log files | Other log entries | Other log entries around the time of the performance problems can also provide information about the root cause. If necessary, submit the logs (ideally as a Support Information Package) to BOC technical support for deeper analysis. Note that an extensive analysis can take a long time. |
Other causes
If the solutions provided in this article do not resolve the issue, contact BOC technical support.
In particular, provide the following information:
A specific use case where the response times are unusually slow.
Time of occurrence: Date and time of the slow use case.
Actual metrics of response times: How long did the slow use case take in seconds, minutes, or hours?
If you operate the BOC product in your own infrastructure (on premise): A current Support Information Package (SIP).
Which solutions from this article have you already implemented and with what result?