Application Scenarios when Using the ArchiMate Library
This section describes the application scenarios for users of the ArchiMate Application Library.
Via the "Design & Document" scenario users will be able to design services and architectures and to plan initiatives.
The purpose of the "Control & Release" scenario is to let users review and release objects with a single click.
Via the "Explore & Contribute" scenario users can get a quick overview of architecture artefacts in ADOIT and contribute to the gathering of enterprise architecture information.
The "Design & Document" Scenario
The purpose of the "Design & Document" scenario is to let you design your services and architectures and to plan your initiatives.
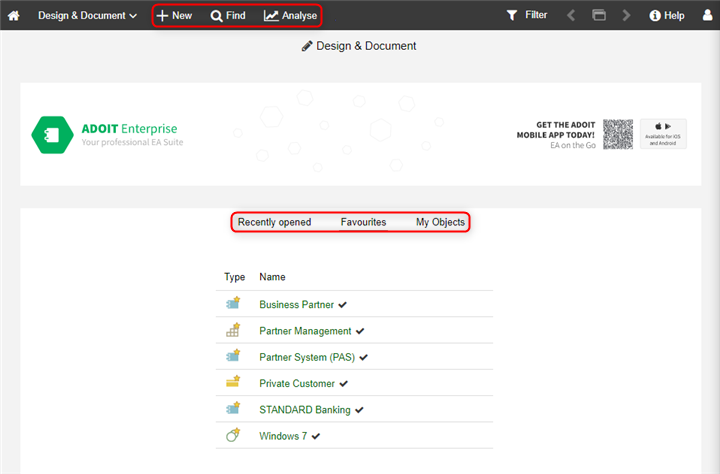
What you will see on the "Design & Document" start page
The start page has the following appearance:
Banner
The perfect place for an image that represents your organisation. Can be configured in the Administration Toolkit.
Recently opened
Your most recently opened models and objects. Sorted by date, with the most recent artefact placed at the top. To see additional artefacts, click Show more....
Favourites
Your favourite models and objects. Sorted alphabetically. To see additional artefacts, click Show more....
My Objects
A compact list of all repository objects for which you are responsible. Grouped by type and sorted alphabetically. To see additional objects, click Show more.... For a more detailed dashboard of your objects, go to Analyse
 > Dashboards > My
Objects.
> Dashboards > My
Objects.
Additional Options
The toolbar at the top of the screen provides access to some of the most used features in ADOIT:
New

Find

Open the Explorer and the search function in ADOIT. Multiple search and filtering options help you quickly find the artefact you are looking for.
Analyse
This page has two sections: Reports and Dashboards. Use the quick links at the top of the page to access these sections. The Reports section shows the Reporting Board, where PDF and RTF reports or graphical views can be created. The Dashboards section provides access to the My Objects, Strategy, Business, Application and Technology dashboards.
My Objects
This dashboard offers a detailed overview of your objects. It displays all repository objects:
- For which you or your Business Actors are assigned as responsible, accountable, consulted or informed business actor (object attributes in the Notebook chapter "Organisation"). Only Business Actors which are connected to your User through Aggregations are considered.
You can confirm the data actuality of your objects, generate reports and open Insights dashboards. In addition, the following attributes are displayed for each object:
Lifecycle state
Action required
Responsibilities according to a RACI matrix
Affiliation
In the Affiliation column you can see whether an object is assigned to you directly or via your Business Actors. Move the mouse pointer over RACI letters to show the assigned User or Business Actor for each relation.
Grouping
In the Grouping column, ADOIT shows you tags for all Grouping elements that aggregate an object. The tag colour can be set via the Tag colour attribute of the Groupings.
Strategy
This area is divided into the widgets "Statistics (All Capabilities)", "Capability Assessment (All Capabilities)" and "All Capabilities".
Statistics (All Capabilities)
The calculation basis for the pie charts in this widget are either all or my Capabilities.
Filter Capabilities (All/My)
You can switch between displaying all or my Capabilities. For details, please refer to the section Filter Objects by Responsibility (All/My).
Business Fit
This pie chart shows the outcome of the assessment of the Business Fit of Capabilities (attribute in the Notebook chapter "Classification"). The assessment is based on:
Functional coverage: Customer assessment to identify whether the desired functionalities have been provided in good quality and appropriate scale.
Number of SLA breaches in the latest period under consideration.
Process Fit
This pie chart shows the outcome of the assessment of the Process Fit of Capabilities (attribute in the Notebook chapter "Classification"). The business processes related to your Capabilities will be scored based on processing times, duration times, process harmonisation grades, and error rates.
Information Fit
This pie chart shows the outcome of the assessment of the Information Fit of Capabilities (attribute in the Notebook chapter "Classification"). Capabilities are assessed in regard to the availability of required information. Typically, the capabilities are ranked on a scale such as:
Needed information is not available.
Needed information is available but difficult to gather.
Information is readily available and easily accessible.
Technological Fit
This pie chart shows the outcome of the assessment of the Technological Fit of Capabilities (attribute in the Notebook chapter "Classification"). The assessment explores from a technical point of view, to what extent the requirements of the Capabilities are met by the supporting applications and technologies.
Cost Fit
This pie chart shows the outcome of the assessment of the Cost Fit of Capabilities (attribute in the Notebook chapter "Classification"). The assessment explores if investment and operating costs are incurred reasonably.
Capability Assessment (All Capabilities)
Capabilities can be scored based on their Business Fit, Process Fit, Information Fit, Technological Fit and Cost Fit. This spider diagram shows the outcome of the assessment of Capabilities according to all of these criteria.
Filter Capabilities (All/My)
You can switch between displaying all or my Capabilities. For details, please refer to the section Filter Objects by Responsibility (All/My).
All Capabilities
This widget provides a detailed overview of Capabilities in the database. You can see at a glance the fitness of the Capabilities listed here according to different criteria.
Filter Capabilities (All/My)
You can switch between displaying all or my Capabilities. For details, please refer to the section Filter Objects by Responsibility (All/My).
Business
This area is divided into the widgets "Statistics (All Business Processes)" and "All Business Processes".
Statistics (All Business Processes)
The calculation basis for the pie charts in this widget are either all or my Business Processes:
Filter Business Processes (All/My)
You can switch between displaying all or my Business Processes. For details, please refer to the section Filter Objects by Responsibility (All/My).
Strategic Importance
This pie chart provides you with an overview of the strategic value of Business Processes in your organisation, ranging from Very low to Very high.
Current level of maturity
This pie chart provides you with an overview of the current levels of maturity of Business Processes in your organisation, ranging from Incomplete process to the final level of maturity, labeled as Optimising process.
Target level of maturity
This pie chart provides you with an overview of the targeted levels of maturity of Business Processes in your organisation, ranging from Incomplete process to the final level of maturity, labeled as Optimising process.
Cost efficiency
This pie chart provides you with an overview of the cost efficiency of Business Processes in your organisation, ranging from Bad to Excellent.
Cycle time
This pie chart provides you with an overview of the cycle time (throughput time) of Business Processes in your organisation, ranging from Bad to Excellent.
Quality
This pie chart provides you with an overview of the quality of the outputs of Business Processes in your organisation, ranging from Bad to Excellent.
Customer satisfaction
This pie chart provides you with an overview of the customer satisfaction with Business Processes in your organisation, ranging from Bad to Excellent.
IT support
This pie chart provides you with an overview of the level of IT support for Business Processes in your organisation, ranging from Bad to Excellent.
Compliance
This pie chart provides you with an overview of the degree of compliance - with laws, norms, regulations etc. - of Business Processes in your organisation, ranging from Bad to Excellent.
All Business Processes
This widget provides a detailed overview of Business Processes in the database. You can see at a glance the fitness of the Business Processes listed here according to different criteria.
Filter Business Processes (All/My)
You can switch between displaying all or my Business Processes. For details, please refer to the section Filter Objects by Responsibility (All/My).
Application
This area is divided into the widgets "Statistics (All Application Components)" and "All Application Components".
Statistics (All Application Components)
The calculation basis for the pie charts in this widget are either all or my Application Components:
Filter Application Components (All/My)
You can switch between displaying all or my Application Components. For details, please refer to the section Filter Objects by Responsibility (All/My).
Application Lifecycle
This pie chart provides you with an overview of the lifecycle state of Application Components in your organisation.
Application Improvement Plans
This pie chart provides you with the following information about Application Components:
Not required: Which applications do not require any improvement?
Required/Planned: For which applications are improvement activities required and planned to be carried out during projects?
Required/Not planned: For which applications are improvement activities required, but not yet planned to be carried out during projects?
Application Standardisation
This pie chart categorizes Application Components according to the types: Standard Software, Custom Software or Miscellaneous (attribute Category in the Notebook chapter "Classification").
Technology Compliance
This pie chart shows for Application Components whether they are compliant, non-compliant or being considered for improvement activities to make them compliant to the underlying technology:
Standard and active technologies (Compliant) or:
Technologies that are going out of support soon (Need for action) or:
Obsolete technologies (Non-compliant)
All Application Components
This widget provides a detailed overview of Application Components in the database. You can see at a glance to what extent there is need for action in regard to the listed Application Components (object attribute Action Required in the Notebook chapter "General").
Filter Applications (All/My)
You can switch between displaying all or my Application Components. For details, please refer to the section Filter Objects by Responsibility (All/My).
Technology
This area is divided into the widgets "All System Software", "Roadmap Status (All System Software)" and "System Software Statistics (All System Software)".
All System Software
This widget provides a quick overview of System Software in the database. You can generate views and reports on your System Software.
Filter System Software (All/My)
You can switch between displaying all or my System Software. For details, please refer to the section Filter Objects by Responsibility (All/My).
Roadmap Status (All System Software)
This pie chart provides an overview of the number and percentage of System Software that are categorised either as a Trial Standard, Active Standard, Deprecated Standard or Obsolete Standard (object attribute Roadmap Status in the Notebook chapter "Lifecycle").
Filter Technologies (All/My)
You can switch between displaying all or my System Software. For details, please refer to the section Filter Objects by Responsibility (All/My).
System Software Usage Statistics (All System Software)
This bar chart provides you with an overview of the number of Application Components that are served by System Software. Each bar represents one System Software.
Filter System Software (All/My)
You can switch between displaying all or my System Software. For details, please refer to the section Filter Objects by Responsibility (All/My).
The "Control & Release" Scenario
The purpose of the "Control & Release" scenario is to let you review and release objects with a single click.
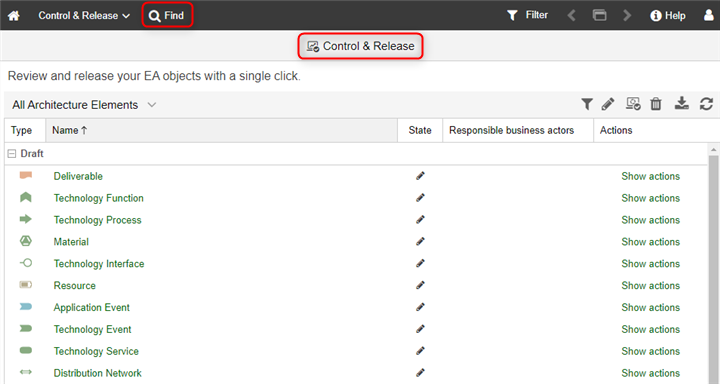
What you will see on the "Control & Release" start page
The start page has the following appearance:
Review and release your EA objects with a single click
Review and release objects. The Control & Release dashboard will show you all repository objects with transitions that you can execute.
Additional Options
The toolbar at the top of the screen provides access to some of the most used features in ADOIT:
Find
Open the Explorer and the search function in ADOIT. Multiple search and filtering options help you quickly find the artefact you are looking for.
"Control & Release" Dashboard
This area lists all repository objects for which you can execute a transition. The objects are grouped by status and sorted alphabetically.
Object Release
You can release objects quickly. In order to execute a transition:
In the Actions column, click the Show actions link to display all available transitions.
Click the appropriate icon.
Filter Architecture Elements (All/My)
You can switch between displaying All or My architecture elements (= objects). For details, please refer to the section Filter Objects by Responsibility (All/My).
Filter Architecture Elements by Object Type
In order to only display objects of a certain type:
Click the Object type filter button
 .
.Select the object types which should be visible in ADOIT.
Click Apply.
Filter Architecture Elements by State
In order to filter objects by state:
- Click the icons
 ,
,
 or
or
 .
.
You can show or hide objects in the state "Draft", "Under review" or "To be deleted".
The "Explore & Contribute" Scenario
Via the "Explore & Contribute" scenario users can get a quick overview of architecture artefacts in ADOIT and contribute to the gathering of enterprise architecture information.
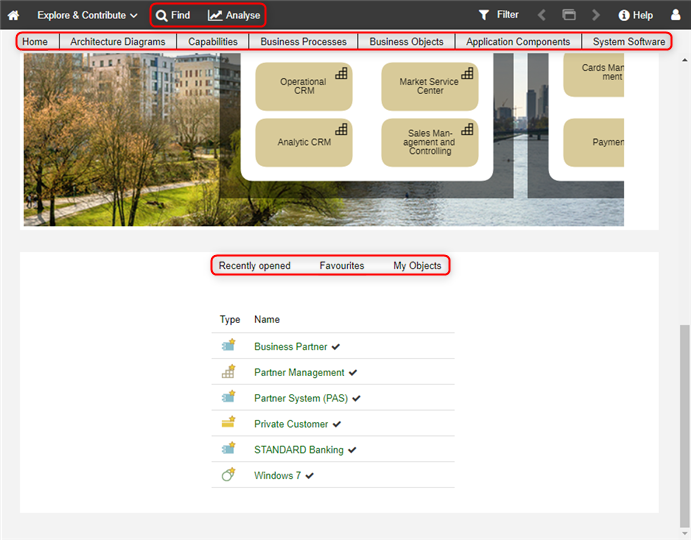
What you will see on the "Explore & Contribute" start page
The start page ("Home") has the following appearance:
Start model
A start model that provides an overview of the organisation’s process architecture. Can be configured in the Administration Toolkit.
Recently opened
Your most recently opened models and objects. Sorted by date, with the most recent artefact placed at the top. To see additional artefacts, click Show more....
Favourites
Your favourite models and objects. Sorted alphabetically. To see additional artefacts, click Show more....
My Objects
A compact list of all repository objects for which you are responsible. Grouped by type and sorted alphabetically. To see additional objects, click Show more.... For a more detailed dashboard of your objects, go to Analyse
> Dashboards > My
Objects.
If no start model has been configured, only the Recently opened, Favourites and My Objects lists are shown on the start page.
This page has six other sections: Architecture Diagrams, Capabilities, Business Processes, Business Objects, Application Components and System Software. Use the quick links at the top of the page to access these sections.
Architecture Diagrams
The Architecture Diagrams dashboard lists all models in the database.
Capabilities
The Capabilities dashboard lists all Capabilities in the database.
Business Processes
The Business Processes dashboard lists all Business Processes in the database.
Business Objects
The Business Objects dashboard lists all Business Objects in the database.
Application Components
The Application Components dashboard lists all Application Components in the database.
System Software
The System Software dashboard lists all System Software elements in the database.
Additional Options
The toolbar at the top of the screen provides access to some of the most used features in ADOIT:
Find
Open the Explorer and the search function in ADOIT. Multiple search and filtering options help you quickly find the artefact you are looking for.
Analyse
This page has two sections: Reports and Dashboards. Use the quick links at the top of the page to access these sections. The Reports section shows the Reporting Board, where PDF and RTF reports or graphical views can be created. The Dashboards section provides access to the My Objects, Strategy, Business, Application and Technology dashboards.
Architecture Diagrams
This table lists all models in the database. The following attributes are displayed for each model:
Last editor
Date of last change
Capabilities
This table lists all Capabilities in the database. The following attributes are displayed for each Capability:
Specialisation
Description
Composed in
Grouping
In the Grouping column, ADOIT shows you tags for all Grouping elements that aggregate a Capability.
Business Processes
This table lists all Business Processes in the database. The following attributes are displayed for each Business Process:
Description
Composed in
Grouping
In the Grouping column, ADOIT shows you tags for all Grouping elements that aggregate a Business Process.
Business Objects
This table lists all Business Objects in the database. The following attributes are displayed for each Business Object:
Specialisation
Description
Accessed by
Grouping
In the Grouping column, ADOIT shows you tags for all Grouping elements that aggregate a Business Object.
Application Components
This table lists all Application Components in the database. The following attributes are displayed for each Application Component:
Specialisation
Lifecycle state
Description
Grouping
In the Grouping column, ADOIT shows you tags for all Grouping elements that aggregate an Application Component.
System Software
This table lists all System Software elements in the database. The following attributes are displayed for each System Software element:
Specialisation
Description
Roadmap status
Grouping
In the Grouping column, ADOIT shows you tags for all Grouping elements that aggregate a System Software element.
My Objects
This area is identical in both the "Design & Document" and "Explore & Contribute" scenarios. Therefore, please refer to the corresponding description here.
Strategy
This area is identical in both the "Design & Document" and "Explore & Contribute" scenarios. Therefore, please refer to the corresponding description here.
Business
This area is identical in both the "Design & Document" and "Explore & Contribute" scenarios. Therefore, please refer to the corresponding description here.
Application
This area is identical in both the "Design & Document" and "Explore & Contribute" scenarios. Therefore, please refer to the corresponding description here.
Technology
This area is identical in both the "Design & Document" and "Explore & Contribute" scenarios. Therefore, please refer to the corresponding description here.