The "Read & Explore" Scenario
For more details on this scenario, refer to the corresponding section according to your product configuration:
By default the option "Read & Explore" based on
![]() Roles is enabled. If you
are unsure which configuration is in use, contact your ADONIS NP administrator.
Roles is enabled. If you
are unsure which configuration is in use, contact your ADONIS NP administrator.
"Read & Explore" Based on Roles
The purpose of the "Read & Explore" scenario is to let you read processes, explore working instructions and process handbooks.
When you switch to the "Read & Explore" scenario, the state filter is activated by
default. Only models and objects in the state "Released" (icon
![]() ) are displayed. Model and object
types without a state set by a release workflow are not affected. This feature can be deactivated in
the Administration Toolkit.
) are displayed. Model and object
types without a state set by a release workflow are not affected. This feature can be deactivated in
the Administration Toolkit.
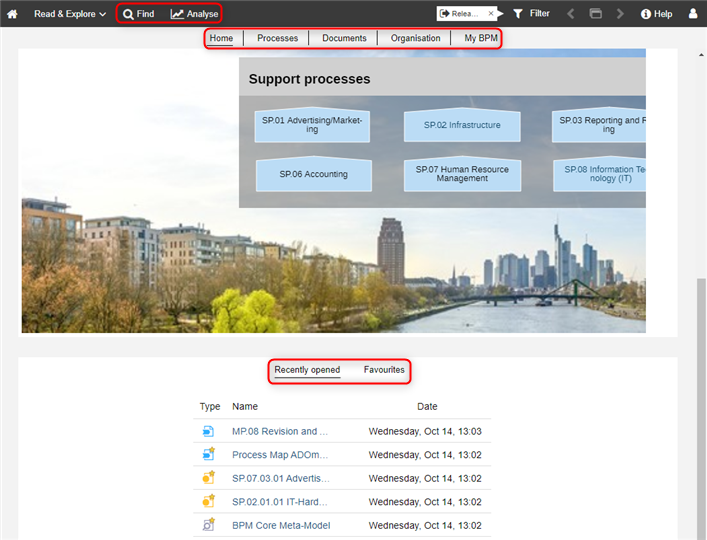
What you will see on the "Read & Explore" start page
The start page ("Home") has the following appearance:
Start model
A start model that provides an overview of the organisation’s process architecture. Can be configured in the Administration Toolkit.
Recently opened
Your most recently opened models. Sorted by date, with the most recent model placed at the top. To see additional models, click Show more....
Favourites
Your favourite models and objects. Sorted alphabetically. To see additional artefacts, click Show more....
If no start model has been configured, only the most recently opened models and favourites are shown on the start page.
This page has four other sections: Processes, Documents, Organisation and My BPM. Use the quick links at the top of the page to access these sections.
Processes
Lists all Business Process Maps and Process Landscapes in the state "Released" (icon
 ).
).Documents
Provides an overview of the documents in the database.
Organisation
Lists all Organisational Units in the database.
My BPM
Keep a constant overview of your processes and the assigned documents, IT system elements and risks with the My BPM dashboard.
Additional Options
The toolbar at the top of the screen provides access to some of the most used features in ADONIS NP:
Find

Open the Explorer and the search function in ADONIS NP. Multiple search and filtering options help you quickly find the artefact you are looking for.
Analyse

This page has two sections: Reports and Dashboards. Use the quick links at the top of the page to access these sections. The Reports section shows the Reporting Board, where PDF and RTF reports or graphical views can be created. The Dashboards section provides access to the My BPM, Analyst, Process Owner, Initiatives, Risks, Compliance and News and Tasks dashboards.
My BPM
This dashboard is divided into the widgets "Processes", "RACI", "Documents", "IT" and "Risks".
At the top, under "![]() My
Roles", you can select your role(s) in your organisation.
My
Roles", you can select your role(s) in your organisation.
My Roles
Under "![]() My Roles", you can select
your role(s) in your organisation:
My Roles", you can select
your role(s) in your organisation:
The Roles which are referenced in your User are displayed by default (object attribute has Role in the Notebook chapter "General information").
You can add Roles from other areas of responsibility.
The selection determines what data is displayed in the widgets and dashboards of the “Read & Explore” scenario.
Add/Remove Roles
In order to add or remove Roles:
Click the button
 .
.Select the Roles you want to add or remove, and then click OK.
Manually added Roles are indicated in bold and marked by an asterisk (*). Only these Roles can
be removed by clicking the button ![]() .
.
The attribute Available for reader assignment allows you to control whether a Role is available for manual assignment.
Processes
This dashboard provides a detailed overview of your processes. It lists all Business Process Diagrams:
For which you are assigned as Process owner, Process manager, Methodical reviewer or Process analyst/designer (model attributes in the Notebook chapter "Organisation") or:
Which contain Tasks for which your Role is assigned as Responsible for execution, Accountable for approving results, Cooperation/Participation or To inform (object attributes in the Notebook chapter "RACI").
RACI
This area provides a detailed overview of all process steps in which you are involved through your Roles. It lists all Tasks for which you are assigned as Responsible for execution, Accountable for approving results, Cooperation/Participation or To inform (object attributes in the Notebook chapter "RACI").
The Tasks are grouped according to the models in which they are contained.
Filter Tasks by Role
This selection determines which Tasks will be displayed in this area. In order to filter Tasks:
Click the widget title (button
 )
to open a drop-down menu.
)
to open a drop-down menu.Select either the menu entry All or one of your Roles.
All lists all Tasks in which you are involved through your Roles.
If you choose one of your Roles, only the Tasks in which you are involved through this specific Role are listed.
Documents
This area provides a detailed overview of the document usage in your processes. It lists all Documents which are either referenced:
In your Business Process Diagrams (model attributes Input in the Notebook chapter "Input/Output" and Referenced documents in the Notebook chapter "Documents") or:
In the Tasks of your Business Process Diagrams (object attributes in the Notebook chapter "Input/Output") or:
In the Processes of your Process Landscapes (object attributes in the Notebook chapter "Input/Output").
Each occurrence in a model or object attribute is listed in a separate row.
IT
This area provides a detailed overview of IT system elements which are referenced in your processes. It lists all repository objects which are either referenced:
In your Business Process Diagrams (model attribute Referenced applications/IT system elements in the Notebook chapter "Systems/Products" or:
In the Tasks of your Business Process Diagrams (object attribute Referenced applications/IT system elements in the Notebook chapter "Systems/Products") or:
In the Processes of your Process Landscapes (object attribute Referenced applications/IT system elements in the Notebook chapter "Systems/Products").
Each occurrence in a model or object attribute is listed in a separate row.
Risks
This area provides a detailed overview of risks which are assigned to your processes. It lists all Risks which are either referenced:
In your Business Process Diagrams (model attribute Assigned risks in the Notebook chapter "Risk management" or:
In the Tasks of your Business Process Diagrams (object attribute Assigned risks in the Notebook chapter "Risks") or:
In the Processes of your Process Landscapes (object attribute Assigned risks in the Notebook chapter "Risks").
Each occurrence in a model or object attribute is listed in a separate row.
Analyst
This dashboard is divided into the widgets "Process Classification", "Model Statistics", "Process Potential Analysis", "KPI Overview" and "Processes (My)".
The selection of models in the widget "Processes (My)" determines which models will be used to calculate the various diagrams of the "Analyst" dashboard.
The "Analyst" dashboard is only available in the ADONIS NP Enterprise Edition.
Process Classification
This radar chart helps to analyse and classify processes based on the attributes Predictability, Complexity, Process frequency, Business value and Process type (model attributes in the Notebook chapter "Classification").
Model Statistics
This widget contains a pie chart showing the distribution of version states for your processes.
Process Potential Analysis
This radar chart helps to analyse improvement potential in your processes based on a simple as-is assessment of the attributes Quality, Cycle time, Cost efficiency, Customer satisfaction, IT support, Compliance, Risk management and Process management maturity (model attributes in the Notebook chapter "Potential and maturity analysis").
KPI Overview
This bar chart allows you to find out quickly if the Performance Indicators in your processes meet their target values (based on an assessment of attributes in the Notebook chapter "Details").
More information about the calculation logic can be found in the info texts of the attributes in the chapter "Details".
Processes (My)
This widget provides a detailed overview of your processes.
Filter Processes
The selection in this widget determines which models will be used to calculate the various diagrams of the "Analyst" area. To only display certain processes:
Click the widget title (button
)
to open a drop-down menu.Select either the menu entry My or Process Owner.
Process Owner lists all Business Process Diagrams and Processes:
- For which you are assigned as Process owner (attribute in the Notebook chapter "Organisation").
My lists all Business Process Diagrams and Processes:
For which you are assigned as Process owner, Process manager, Methodical reviewer or Process analyst/designer (model attributes in the Notebook chapter "Organisation").
Which contain Tasks for which your Role is assigned as Responsible for execution, Accountable for approving results, Cooperation/Participation or To inform (object attributes in the Notebook chapter "RACI").
Process Owner
This dashboard is divided into the widgets " Processes (Process Owner)", "Model Statistics", "My Assets", "KPI Overview" and "KPIs (My)".
Processes (Process Owner)
This widget provides a detailed overview of your processes.
Filter Processes
This selection determines what data will be displayed in the "Processes (Process Owner)" and "Model Statistics" widgets. To filter processes:
Click the widget title (button
)
to open a drop-down menu.Select either the menu entry My or Process Owner.
Process Owner lists all Business Process Diagrams and Process Landscapes:
- For which you are assigned as Process owner (attribute in the Notebook chapter "Organisation").
My lists all Business Process Diagrams and Process Landscapes:
For which you are assigned as Process owner, Process manager, Methodical reviewer or Process analyst/designer (model attributes in the Notebook chapter "Organisation").
Which contain Tasks for which your Role is assigned as Responsible for execution, Accountable for approving results, Cooperation/Participation or To inform (object attributes in the Notebook chapter "RACI").
Model Statistics
This widget contains pie charts showing the distribution of version states for your processes and open questions for the Tasks and Processes in your processes (object attribute Open questions in the Notebook chapter "CIP") .
My Assets
This widget provides a quick overview of your assets. It lists all repository objects for which you are assigned as Responsible person (object attribute in the Notebook chapter "Organisation").
KPI Overview
This bar chart allows you to find out quickly if your Performance Indicators meet their target values (based on an assessment of attributes in the Notebook chapter "Details").
More information about the calculation logic can be found in the info texts of the attributes in the chapter "Details".
KPIs (My)
This widget provides a detailed overview of your Performance Indicators.
Filter KPIs
The selection in this widget determines which Performance Indicators will be used to calculate the bar chart in the "KPI Overview" widget. In order to only display certain Performance Indicators:
Click the widget title (button
)
to open a drop-down menu.Select either the menu entry My, In my Processes or My & In my Processes.
My lists all Performance Indicators for which you are assigned as Responsible person (object attribute in the Notebook chapter "Organisation").
In my processes lists all Performance Indicators in Business Process Diagrams and Process Landscapes:
For which you are assigned as Process owner, Process manager, Methodical reviewer or Process analyst/designer (model attributes in the Notebook chapter "Organisation").
Which contain Tasks for which your Role is assigned as Responsible for execution, Accountable for approving results, Cooperation/Participation or To inform (object attributes in the Notebook chapter "RACI").
My & In my Processes combines both options.
Initiatives
This dashboard is divided into the widgets "My Initiatives", "Initiative Progress", "My Initiatives - Radar" and "Initiatives".
The "Initiatives" dashboard is only available in the ADONIS NP Enterprise Edition.
My Initiatives
This widget provides a quick overview of your Initiatives. It lists all Initiatives for which you are assigned as Responsible person (object attribute in the Notebook chapter "Organisation").
You can see at a glance the progress of the Initiatives listed here. You can also find out quickly about the data actuality of the listed Initiatives.
Initiative Progress
This pie chart provides an overview of the progress of your Initiatives. The progress is calculated automatically based on a comparison of the "as is" state against the "to be" state of the time, costs and efforts spent on an Initiative (object attribute Progress (Automatic) in the Notebook chapter "Controlling - Initiative").
My Initiatives - Radar
This radar chart helps to analyse and classify your Initiatives based on the attributes Planned costs, Current costs, Planned effort, Current effort and Degree of completion (object attributes in the Notebook chapters "General information" and "Controlling - Initiative").
Initiatives
This bar chart categorizes your Initiatives based on their State (object attribute in the Notebook chapter "Controlling - Initiative").
Risks
This dashboard is divided into the widgets "My Risks", "ICS Statistics", "My Controls", "Control Frequency" and "Risk Management Indicators".
The "Risks" dashboard is only available in the ADONIS NP Enterprise Edition.
My Risks
This widget provides a quick overview of your Risks. It lists all Risks for which you are assigned as Responsible person (object attribute in the Notebook chapter "Organisation").
The risks are grouped according to their Risk Group (object attribute in the Notebook chapter "General information").
You can see at a glance the severity of the Risks listed here. You can also find out quickly about the data actuality of the listed Risks.
ICS Statistics
The first pie chart in this widget shows the distribution of risk assessment values for your Risks. The Value at risk is calculated based on the Likelihood, Impact and Detection values of a Risk (object attributes in the Notebook chapter "Risk assessment").
The second pie chart shows the distribution of Control methods for your Controls (object attribute in the Notebook chapter "General information").
My Controls
This widget provides a quick overview of your Controls. It lists all Controls for which you are assigned as Responsible person (object attribute in the Notebook chapter "Organisation").
You can find out quickly about the data actuality of the listed controls here.
Control Frequency
This bar chart categorizes your Controls based on the Frequency of control execution (object attribute in the Notebook chapter "General information").
Risk Management Indicators
The first indicator gauge in this widget shows the average value of the Value at risk attribute across your Risks (object attribute in the Notebook chapter "Risk assessment").
The second and third indicator gauges show the average values of the Design Effectiveness and Operating Effectiveness attributes across your Controls (object attributes in the Notebook chapter "Control assessment").
Compliance
This dashboard is divided into the widgets "My Control Objectives", "Compliance Statistics" and "Maturity Assessment".
The "Compliance" dashboard is only available in the ADONIS NP Enterprise Edition.
My Control Objectives
This widget provides a quick overview of the assets of your Control Objectives. It lists the assets of all Control Objectives for which you are assigned as Responsible person (object attribute in the Notebook chapter "Organisation").
Assets are repository objects which are connected to your Control Objectives by the reference Assigned control objectives. In the widget, the assets are grouped according to their Control Objective.
For each combination of Control Objective and asset, you can see whether an action is required and what the maturity assessment of that combination is (attributes in the Notebook of the reference Assigned control objectives, chapters "General information" and "Maturity assessment"). You can also find out quickly about the data actuality of the listed assets.
Compliance Statistics
This pie chart shows across all combinations of Control Objectives and assets to what extent there is need for action (attribute Action required in the Notebook of the reference Assigned control objectives, chapter "General information").
Maturity Assessment
This bar chart provides an overview of the maturity level of your Control Objectives by evaluating their assets according to specific categories: undermatch, match, overmatch. The maturity level is calculated automatically based on a comparison of the "as is" state against the "to be" state (attributes As-is maturity level and To-be maturity level in the Notebook of the reference Assigned control objectives, chapter "Maturity Assessment").
News & Tasks
This dashboard is identical in both the "Design & Document" and "Read & Explore" scenarios. Therefore, please refer to the corresponding description here.
"Read & Explore" Based on Organisational Units
The purpose of the "Read & Explore" scenario is to let you read processes, explore working instructions and process handbooks.
When you switch to the "Read & Explore" scenario, the state filter is activated by
default. Only models and objects in the state "Released" (icon
![]() ) are displayed. Model and object
types without a state set by a release workflow are not affected. This feature can be deactivated in
the Administration Toolkit.
) are displayed. Model and object
types without a state set by a release workflow are not affected. This feature can be deactivated in
the Administration Toolkit.
What you will see on the "Read & Explore" start page
The start page ("Home") has the following appearance:
Start model
A start model that provides an overview of the organisation’s process architecture. Can be configured in the Administration Toolkit.
Recently opened
Your most recently opened models. Sorted by date, with the most recent model placed at the top. To see additional models, click Show more....
Favourites
Your favourite models and objects. Sorted alphabetically. To see additional artefacts, click Show more....
If no start model has been configured, only the most recently opened models and favourites are shown on the start page.
This page has four other sections: Processes, Documents, Organisation and My BPM. Use the quick links at the top of the page to access these sections.
Processes
Lists all Business Process Maps and Process Landscapes in the state "Released" (icon
).Documents
Provides an overview of the documents in the database.
Organisation
Lists all Organisational Units in the database.
My BPM
Keep a constant overview of your processes and the assigned documents, IT system elements and risks with the My BPM dashboard.
Additional Options
The toolbar at the top of the screen provides access to some of the most used features in ADONIS NP:
Find
Open the Explorer and the search function in ADONIS NP. Multiple search and filtering options help you quickly find the artefact you are looking for.
Analyse
This page has two sections: Reports and Dashboards. Use the quick links at the top of the page to access these sections. The Reports section shows the Reporting Board, where PDF and RTF reports or graphical views can be created. The Dashboards section provides access to the My BPM, Analyst, Process Owner, Initiatives, Risks, Compliance and News and Tasks dashboards.
My BPM
This dashboard is divided into the widgets "Processes", "Documents", "IT" or "Risks".
At the top, under "![]() My
Organisational Units", you can see the Organisational Units you are assigned to.
My
Organisational Units", you can see the Organisational Units you are assigned to.
My Organisational Units
Under "![]() My Organisational Units",
you can see the Organisational Units you are assigned to in your organisation:
My Organisational Units",
you can see the Organisational Units you are assigned to in your organisation:
- The Organisational Units which are referenced in your User are displayed (object attribute Belongs to in the Notebook chapter "General").
Your Organisational Units determine what data is displayed in the widgets and dashboards of the “Read & Explore” scenario.
Processes
This area provides a detailed overview of your processes. It lists all Business Process Diagrams:
For which you are assigned as Process owner, Process manager, Methodical reviewer or Process analyst/designer (model attributes in the Notebook chapter "Organisation") or:
For which your Organisational Unit is assigned (model attribute Scope in the Notebook chapter "General information").
Documents
This area provides a detailed overview of the document usage in your processes. It lists all Documents which are either referenced:
In your Business Process Diagrams (model attributes Input in the Notebook chapter "Input/Output" and Referenced documents in the Notebook chapter "Documents") or:
In the Tasks of your Business Process Diagrams (object attributes in the Notebook chapter "Input/Output") or:
In the Processes of your Process Landscapes (object attributes in the Notebook chapter "Input/Output").
Each occurrence in a model or object attribute is listed in a separate row.
IT
This area provides a detailed overview of IT system elements which are referenced in your processes. It lists all repository objects which are either referenced:
In your Business Process Diagrams (model attribute Referenced applications/IT system elements in the Notebook chapter "Systems/Products" or:
In the Tasks of your Business Process Diagrams (object attribute Referenced applications/IT system elements in the Notebook chapter "Systems/Products") or:
In the Processes of your Process Landscapes (object attribute Referenced applications/IT system elements in the Notebook chapter "Systems/Products").
Each occurrence in a model or object attribute is listed in a separate row.
Risks
This area provides a detailed overview of risks which are assigned to your processes. It lists all Risks which are either referenced:
In your Business Process Diagrams (model attribute Assigned risks in the Notebook chapter "Risk management" or:
In the Tasks of your Business Process Diagrams (object attribute Assigned risks in the Notebook chapter "Risks") or:
In the Processes of your Process Landscapes (object attribute Assigned risks in the Notebook chapter "Risks").
Each occurrence in a model or object attribute is listed in a separate row.
Analyst
This dashboard is divided into the widgets "Process Classification", "Model Statistics", "Process Potential Analysis", "KPI Overview" and "Processes (My)".
The selection of models in the widget "Processes (My)" determines which models will be used to calculate the various diagrams of the "Analyst" dashboard.
The "Analyst" dashboard is only available in the ADONIS NP Enterprise Edition.
Process Classification
This radar chart helps to analyse and classify processes based on the attributes Predictability, Complexity, Process frequency, Business value and Process type (model attributes in the Notebook chapter "Classification").
Model Statistics
This widget contains a pie chart showing the distribution of version states for your processes.
Process Potential Analysis
This radar chart helps to analyse improvement potential in your processes based on a simple as-is assessment of the attributes Quality, Cycle time, Cost efficiency, Customer satisfaction, IT support, Compliance, Risk management and Process management maturity (model attributes in the Notebook chapter "Potential and maturity analysis").
KPI Overview
This bar chart allows you to find out quickly if the Performance Indicators in your processes meet their target values (based on an assessment of attributes in the Notebook chapter "Details").
More information about the calculation logic can be found in the info texts of the attributes in the chapter "Details".
Processes (My)
This widget provides a detailed overview of your processes.
Filter Processes
The selection in this widget determines which models will be used to calculate the various diagrams of the "Analyst" dashboard. To only display certain processes:
Click the widget title (button
)
to open a drop-down menu.Select either the menu entry My or Process Owner.
Process Owner lists all Business Process Diagrams and Processes:
- For which you are assigned as Process owner (attribute in the Notebook chapter "Organisation").
My lists all Business Process Diagrams and Processes:
For which you are assigned as Process owner, Process manager, Methodical reviewer or Process analyst/designer (model attributes in the Notebook chapter "Organisation").
For which your Organisational Unit is assigned (model attribute Scope in the Notebook chapter "General information").
Process Owner
This dashboard is divided into the widgets " Processes (Process Owner)", "Model Statistics", "My Assets", "KPI Overview" and "KPIs (My)".
Processes (Process Owner)
This widget provides a detailed overview of your processes.
Filter Processes
This selection determines what data will be displayed in the "Processes (Process Owner)" and "Model Statistics" widgets. To filter processes:
Click the widget title (button
)
to open a drop-down menu.Select either the menu entry My or Process Owner.
Process Owner lists all Business Process Diagrams and Process Landscapes:
- For which you are assigned as Process owner (attribute in the Notebook chapter "Organisation").
My lists all Business Process Diagrams and Process Landscapes:
For which you are assigned as Process owner, Process manager, Methodical reviewer or Process analyst/designer (model attributes in the Notebook chapter "Organisation").
For which your Organisational Unit is assigned (model attribute Scope in the Notebook chapter "General information").
Model Statistics
This widget contains pie charts showing the distribution of version states for your processes and open questions for the Tasks and Processes in your processes (object attribute Open questions in the Notebook chapter "CIP") .
My Assets
This widget provides a quick overview of your assets. It lists all repository objects for which you are assigned as Responsible person (object attribute in the Notebook chapter "Organisation").
KPI Overview
This bar chart allows you to find out quickly if your Performance Indicators meet their target values (based on an assessment of attributes in the Notebook chapter "Details").
More information about the calculation logic can be found in the info texts of the attributes in the chapter "Details".
KPIs (My)
This widget provides a detailed overview of your Performance Indicators.
Filter KPIs
The selection in this widget determines which Performance Indicators will be used to calculate the bar chart in the "KPI Overview" widget. In order to only display certain Performance Indicators:
Click the widget title (button
)
to open a drop-down menu.Select either the menu entry My, In my Processes or My & In my Processes.
My lists all Performance Indicators for which you are assigned as Responsible person (object attribute in the Notebook chapter "Organisation").
In my processes lists all Performance Indicators in Business Process Diagrams and Process Landscapes:
For which you are assigned as Process owner, Process manager, Methodical reviewer or Process analyst/designer (model attributes in the Notebook chapter "Organisation").
For which your Organisational Unit is assigned (model attribute Scope in the Notebook chapter "General information").
My & In my Processes combines both options.
Initiatives
This dashboard is divided into the widgets "My Initiatives", "Initiative Progress", "My Initiatives - Radar" and "Initiatives".
The "Initiatives" dashboard is only available in the ADONIS NP Enterprise Edition.
My Initiatives
This widget provides a quick overview of your Initiatives. It lists all Initiatives for which you are assigned as Responsible person (object attribute in the Notebook chapter "Organisation").
You can see at a glance the progress of the Initiatives listed here. You can also find out quickly about the data actuality of the listed Initiatives.
Initiative Progress
This pie chart provides an overview of the progress of your Initiatives. The progress is calculated automatically based on a comparison of the "as is" state against the "to be" state of the time, costs and efforts spent on an Initiative (object attribute Progress (Automatic) in the Notebook chapter "Controlling - Initiative").
My Initiatives - Radar
This radar chart helps to analyse and classify your Initiatives based on the attributes Planned costs, Current costs, Planned effort, Current effort and Degree of completion (object attributes in the Notebook chapters "General information" and "Controlling - Initiative").
Initiatives
This bar chart categorizes your Initiatives based on their State (object attribute in the Notebook chapter "Controlling - Initiative").
Risks
This dashboard is divided into the widgets "My Risks", "ICS Statistics", "My Controls", "Control Frequency" and "Risk Management Indicators".
The "Risks" dashboard is only available in the ADONIS NP Enterprise Edition.
My Risks
This widget provides a quick overview of your Risks. It lists all Risks for which you are assigned as Responsible person (object attribute in the Notebook chapter "Organisation").
The risks are grouped according to their Risk Group (object attribute in the Notebook chapter "General information").
You can see at a glance the severity of the Risks listed here. You can also find out quickly about the data actuality of the listed Risks.
ICS Statistics
The first pie chart in this widget shows the distribution of risk assessment values for your Risks. The Value at risk is calculated based on the Likelihood, Impact and Detection values of a Risk (object attributes in the Notebook chapter "Risk assessment").
The second pie chart shows the distribution of Control methods for your Controls (object attribute in the Notebook chapter "General information").
My Controls
This widget provides a quick overview of your Controls. It lists all Controls for which you are assigned as Responsible person (object attribute in the Notebook chapter "Organisation").
You can find out quickly about the data actuality of the listed controls here.
Control Frequency
This bar chart categorizes your Controls based on the Frequency of control execution (object attribute in the Notebook chapter "General information").
Risk Management Indicators
The first indicator gauge in this widget shows the average value of the Value at risk attribute across your Risks (object attribute in the Notebook chapter "Risk assessment").
The second and third indicator gauges show the average values of the Design Effectiveness and Operating Effectiveness attributes across your Controls (object attributes in the Notebook chapter "Control assessment").
Compliance
This dashboard is divided into the widgets "My Control Objectives", "Compliance Statistics" and "Maturity Assessment".
The "Compliance" dashboard is only available in the ADONIS NP Enterprise Edition.
My Control Objectives
This widget provides a quick overview of the assets of your Control Objectives. It lists the assets of all Control Objectives for which you are assigned as Responsible person (object attribute in the Notebook chapter "Organisation").
Assets are repository objects which are connected to your Control Objectives by the reference Assigned control objectives. In the widget, the assets are grouped according to their Control Objective.
For each combination of Control Objective and asset, you can see whether an action is required and what the maturity assessment of that combination is (attributes in the Notebook of the reference Assigned control objectives, chapters "General information" and "Maturity assessment"). You can also find out quickly about the data actuality of the listed assets.
Compliance Statistics
This pie chart shows across all combinations of Control Objectives and assets to what extent there is need for action (attribute Action required in the Notebook of the reference Assigned control objectives, chapter "General information").
Maturity Assessment
This bar chart provides an overview of the maturity level of your Control Objectives by evaluating their assets according to specific categories: undermatch, match, overmatch. The maturity level is calculated automatically based on a comparison of the "as is" state against the "to be" state (attributes As-is maturity level and To-be maturity level in the Notebook of the reference Assigned control objectives, chapter "Maturity Assessment").
News & Tasks
This dashboard is identical in both the "Design & Document" and "Read & Explore" scenarios. Therefore, please refer to the corresponding description here.