Designing report template
Starting with template creation
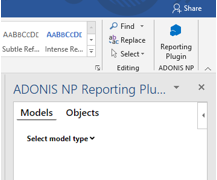
On Report Creator start page (after login), select Create template Note: 'Select model type' should appear after several seconds. If not, it means that the Report Creator is not properly configured and has no access to the ADONIS REST API.
Selecting Initial Word Template
1. Start MS Word
Begin by opening Microsoft Word.
2. Choose a Template
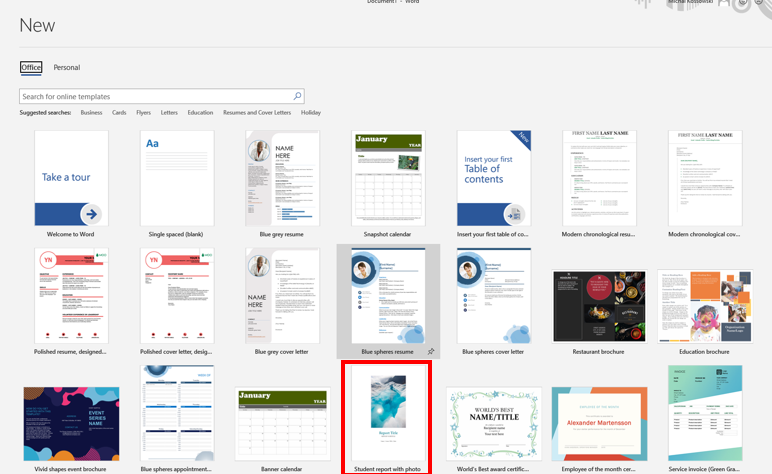
Use an empty document or any existing template, such as standard Word templates or corporate templates. Predefined templates can speed up the design process. In this demonstration, the predefined template 'Student report with photo' is used.
Note: Ensure there are no predefined tables in the main part of the document, as Report Creator tables cannot be placed inside existing tables. Use Word Paragraph Marks to identify existing tables.
Creating start page with fixed content
This section focuses on designing the start page (or any other fixed content) of your report using the Report Creator.
1. Insert your own graphic
You can personalize the start page of your report by inserting your own graphics.
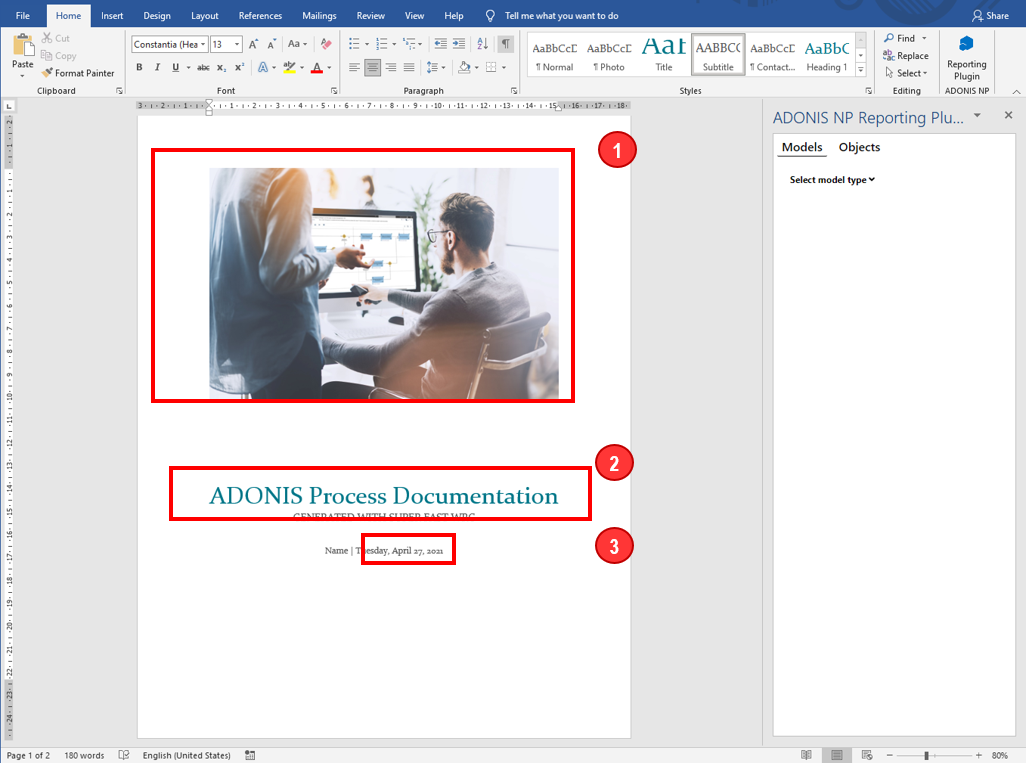
2. Insert fixed text
Any manually entered text will be fixed and displayed in every final report. This is useful for creating elements like the start page of the report.
3. Use standard Word elements
Standard Word elements such as variables (e.g., Date/Time) and the table of contents can also be incorporated into the start page.
Creating dynamic part - models loop
The dynamic part is created as a loop for models or objects. This is because in most cases multiple models/objects are selected for the report and the same part of the template will be used for each mode/object in a final report. This chapter describes creatin dynamic part for models (e.g. BPMN diagrams)
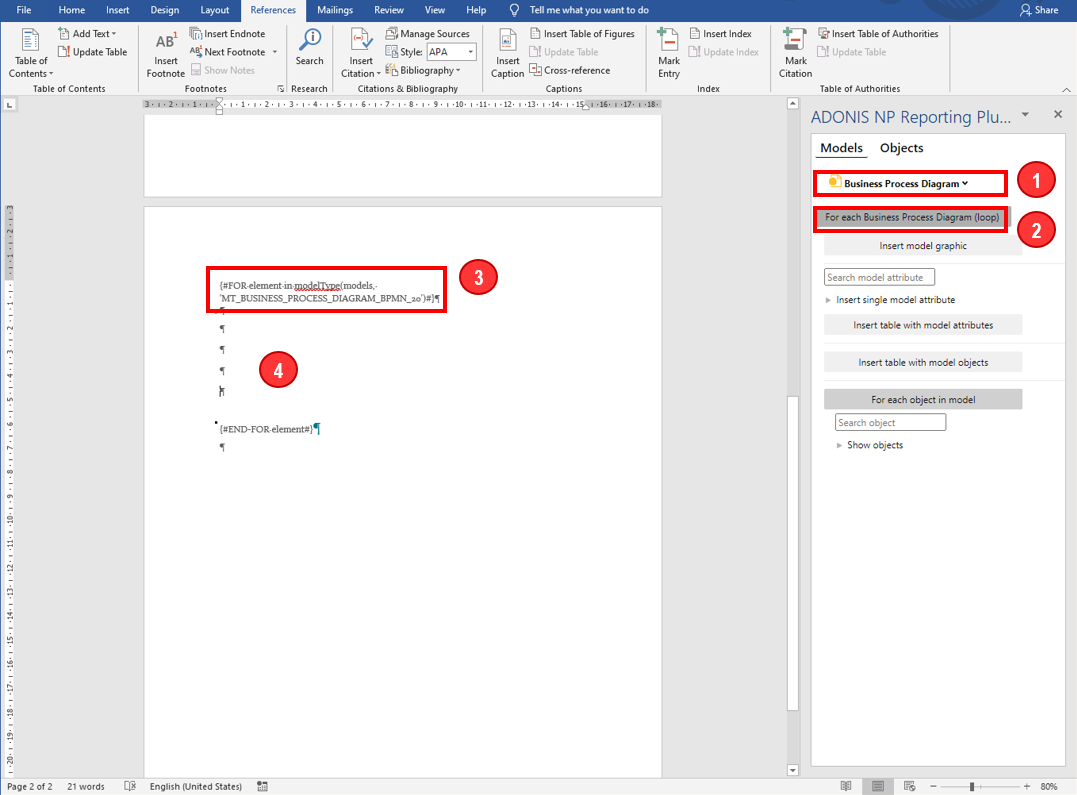
1. Select model type
Choose the specific model type for the dynamic part of the report.
2. Enter the loop in Word document
Click the designated button to enter the loop directly in the Word document.
3. Keep in mind proper syntax
Remember, every dynamic part in the template starts with {# and ends with #}, and all text inside these characters is interpreted by the Report Creator plugin. Avoid changing it to prevent errors.
4. Place every dynamic part in loop
The entire dynamic part should be placed between {#FOR ... and {#END} elements. In the final report, this part will repeat for every model selected.
Tip
- Insert some blank lines in the document for easier navigation and clarity.
Creating dynamic part - single model attributes
It is possible to enter single model attributes, e.g. model name and results.
1. Expand List of Model Attributes
Attributes are organized in chapters as in ADONIS.
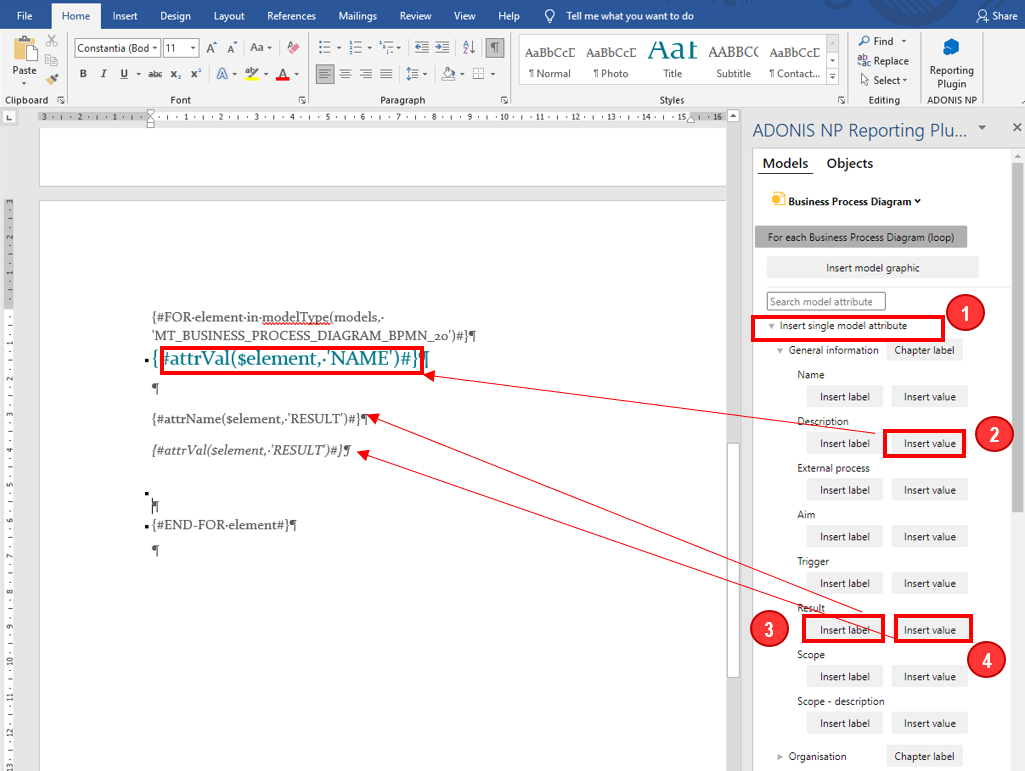
2. Insert Value of Model Name
This will create an entry representing the value of the model name. Apply any desired text formatting (e.g., Heading 1 for separate heading/chapter for every model in the final report).
3. Insert Label
You can insert attribute label, which is a fixed name of an attributes, e.g. name of the attribute 'Results'.
4. Insert Attribute Value
You can insert value (e.g. text, reference) of certain attribute, e.g. values of attribute 'Results'.
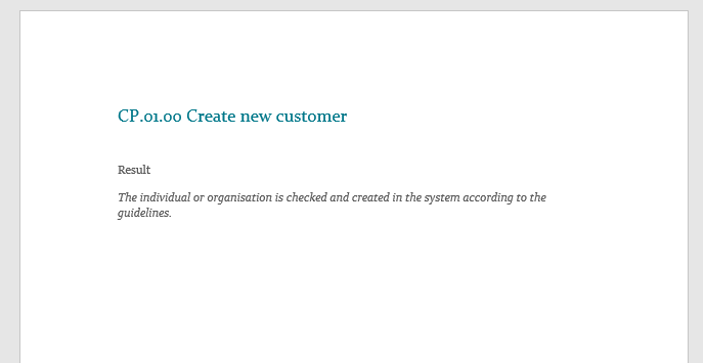
Results
Steps above in the final report will be visible like this:
Creating dynamic part - table with model attributes
It is possible to create tables with one or more model attributes
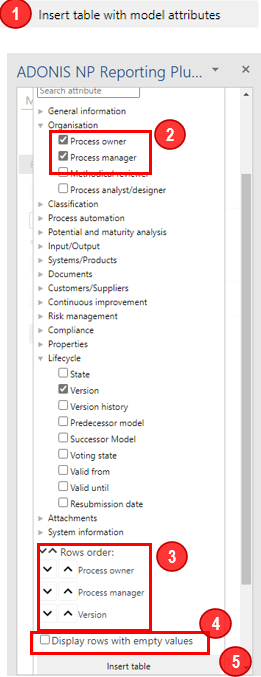
1. Start the table Widget
Start the table widget by pressing the designated button.
2. Select Attributes for Display
- Select the attributes you want to be displayed in the table.
3. Sort Attributes in Table
- Organize the attributes in the table as per your requirement.
4. Hide/Show Rows with Empty Values
- Choose to either hide or show rows that contain empty attribute values.
5. Insert Table
- Press the 'Insert table' button to add the table into your document.
Results
Steps above in the final report will be presented like this:
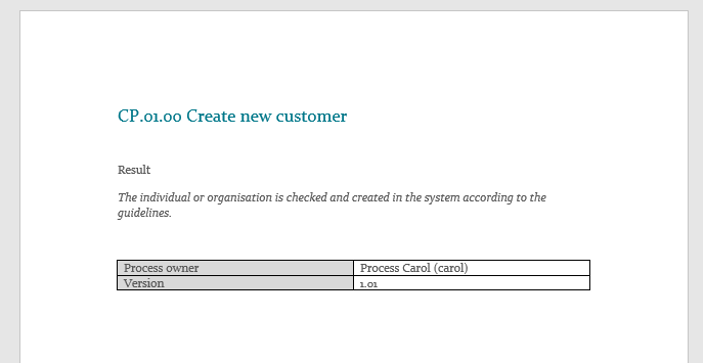
Tip
- Note that Manager was not added because this attribute is empty in this example model.
- Using advanced functions you can also include data from referenced objects, e.g., look for ‚Process’ object that is referencing this BPMN diagram and put some attributes from this ‚Process’ object also in the table above.
Model Graphic
As next, you can insert model graphic.
Click on this button to insert model graphic and modify graphic width / height as needed (default size is A4).
Tip
- It is recommended to insert a page break before and after inserting model graphic.
- By default, page size is set to A4 page (16 cm width, 25 cm high). You have to change it manually in case you use different page size (or e.g. landscape layout).
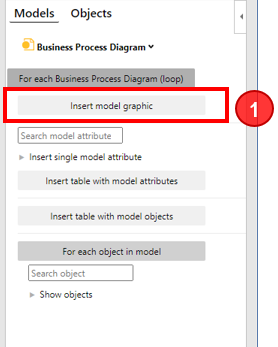
Table with model objects
It is possible to create a table listing in rows all objects of one or different types from the model.
For this:
Start the table widget by pressing.
Select object types that should be listed in rows of the table (e.g. Start Event, End Event, and Task).
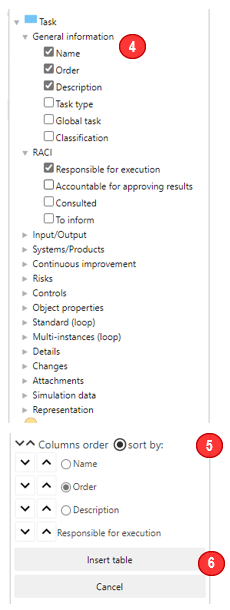
Expand selected object (or search object’s attribute) to define which attributes should be displayed in columns.
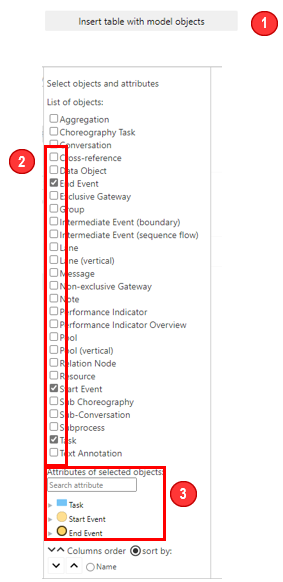
Select attributes that will be displayed in columns (e.g., Order, Description, Responsible). Note that if the same attribute exists in other objects, it will be automatically selected for all objects
Sort columns order and select which columns should be used for sorting (e.g. Order)
Press 'Insert table' button.
Results
Steps above in the final report will be presented like this:
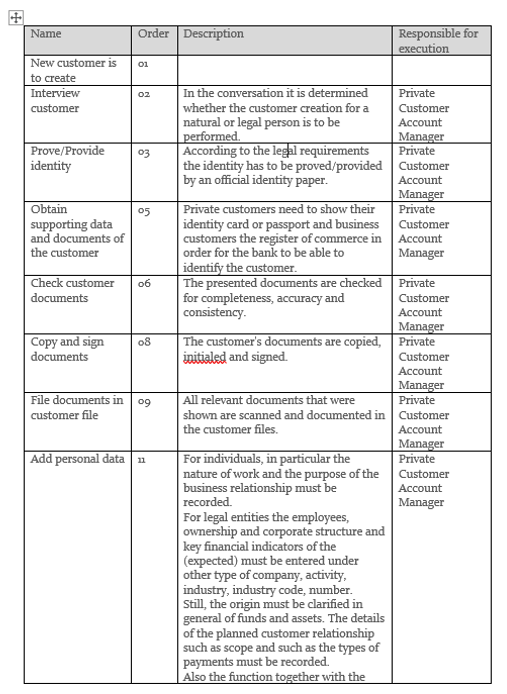
Tip
- You can also make your own formatting (e.g. shading) of the table – in this example first row is now in grey
- You can also change default width of table columns. To do so, enter ‚Table properties’, go to ‚Column’ settings and uncheck ‚Preferred width’. Now it will be possible to change column width e.g. as on picture above
- Using advanced functions you can also add a column containing the name of connector and the attribute of target object of this connector (e.g., ‚Order’). In that way you can compose a text that is build based on gateways conditions, e.g., if ,yes’ go to step 17 .
Table for every object in model
It is also possible to create a table with attributes of selected object type (e.g. Performance Indicator details) for every object in a model (keep in mind that we are now inside a model loop). If there are many objects of the given type in a model, it means that many tables will be created. To create such a table in the template, a loop for objects must be created
For this:
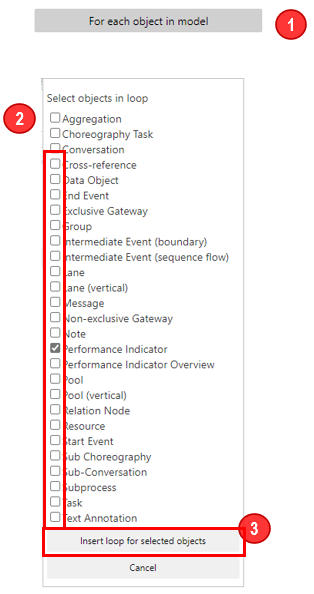
Create objects loop by pressing.
Select object types that should be included in the loop (e.g. Performance Indicators).
Confirm selection. The loop will be created.
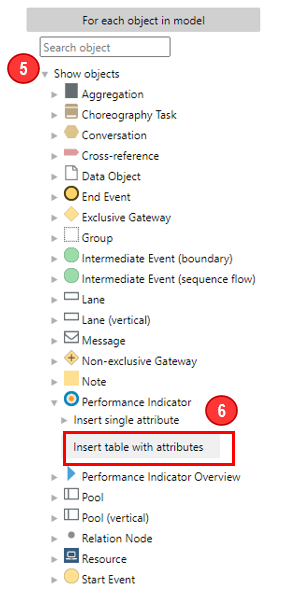
Now that the loop for all Performance Indicators in the model is defined, it is possible either to display objects attributes in form of simple text or a table. In this tutorial, the example for a table is presented:
First, move Word cursor inside the loop, before '{#END-FOR...'.
Expand list of available objects
Press 'Insert table with attributes' button.
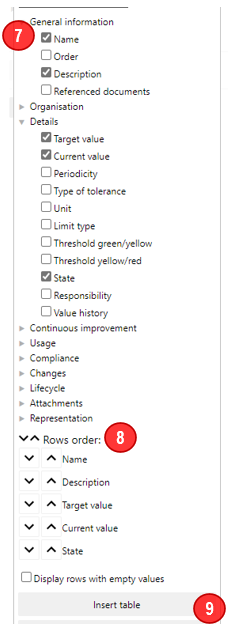
Select attributes that will be displayed in rows (e.g. Name, Description, Target value, Current value, State).
Sort rows order
Press 'Insert table' button.
Results
Steps above in the final report will be presented like this:
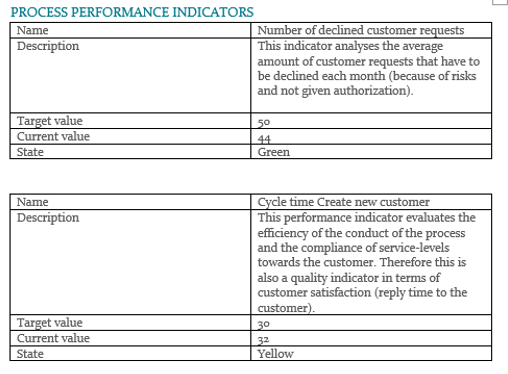
Tip
- Enter an empty line directly after table definition so that one table after another will have an empty line between.