Insights Dashboards
An Insights dashboard displays essential information about a specific object in your organisation, and has a quick access area for key features.
Insights Dashboard vs. Notebook
An Insights dashboard summarizes the most important information about an object, such as aggregated data, information about referenced objects with charts etc. This information is presented in an easily understandable and visually appealing way. The Notebook, on the other hand, is a dedicated tool for editing and reading master data and contains no graphics. The Notebook is for data management, while an Insights dashboard is for reading and analysis.
Types of Insights Dashboards
The availability of Insights dashboards depends on the application library. In the ArchiMate Application Library, the following Insights dashboards are available:
Insights Dashboard for Application Components
Provides insights into Application Components
Insights Dashboard for Capabilities
Provides insights into Capabilities
Insights Dashboard for Business Objects
Provides insights into Business Objects
Insights Dashboard for System Software Elements
Provides insights into System Software elements
In the ADOIT Standard Application Library, the following Insights dashboards are available:
Insights Dashboard for Applications
Provides insights into Applications
Insights Dashboard for Business Capabilities
Provides insights into Business Capabilities
Insights Dashboard for Business Objects
Provides insights into Business Objects
Insights Dashboard for Technologies
Provides insights into Technologies
Open Insights Dashboard
To open an Insights dashboard:
- Right-click the object, point to Open, and then click Insights
 .
.
You can open an Insights dashboard this way using e.g. the Explorer or the graphical editor as a
starting point. Additionally, it is possible to open an Insights dashboard directly from the
Notebook by clicking the Insights button
![]() .
.
Show/Hide Empty Sections
By default, all areas of an Insights dashboard for which no data is available are hidden. To show or hide empty sections:
- Click the Show empty sections button
 at the top of the Insights
dashboard.
at the top of the Insights
dashboard.
Available Functions
Across all widgets (= small program windows) of the various Insights dashboards the following functions are available:
Show a tooltip with information about the widget (icon
 )
)Export the content of a widget as a PDF file or Excel file (XLSX format) (icon
 )
)Refresh a widget to get the latest data (icon
 )
)Filter data in columns to show the elements you want and hide the rest:
Show or hide filters (icon
 )
)Clear all filters (icon
 )
)
Show or hide columns (icon
 )
)
Users of the ArchiMate Application Library click the More button
![]() to access these functions. Users of
the ADOIT Standard Application Library find the same or similar functions in the menu bar or click
the column headers.
to access these functions. Users of
the ADOIT Standard Application Library find the same or similar functions in the menu bar or click
the column headers.
Insights Dashboard for Application Components [ArchiMate Library]
This dashboard consists of the following areas:
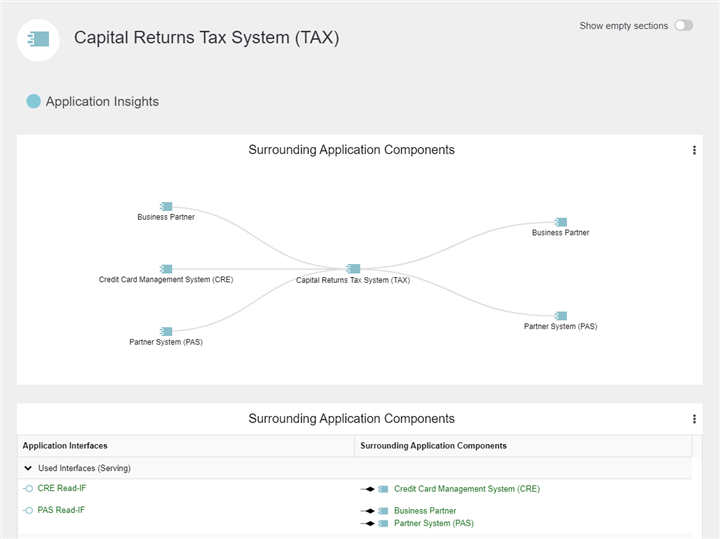
Header
The header is the area along the top of the dashboard. The name of the Application Component you are interested in is shown here.
Beneath the name, ADOIT shows you tags for all Grouping elements that aggregate this Application Component. The tag colour can be set via the Tag colour attribute of the Groupings.
Application Insights
Surrounding Application Components (Tree Diagram)
This widget shows surrounding Application Components that use or provide Application Interfaces to the Application Component currently being viewed.
The following paths are evaluated:
Application Component
>Composed of>Application Interface>Serves>Application ComponentApplication Component
<Served by<Application Interface<Part of<Application Component
Each node represents an Application Component. The centre node is the Application Component you are interested in. The Application Interfaces connecting the Application Components are shown as branches, with the provided interfaces (Composition) to the left and the used interfaces (Serving) to the right.
The following options are available:
- Click a node title to open the Notebook of the object.
Surrounding Application Components (Table)
This table lists the provided and used Application Interfaces of the Application Component and the surrounding Application Components that use or provide these Application Interfaces.
Application Component Score
This gauge chart shows the current value of the following attributes of the Application Component (one gauge for each attribute):
Strategic importance
Business fit
IT fit
Cost fit
Business continuity fit
Security fit
Redundancy Analysis
This table helps you detect redundant Application Components. It lists all other Application Components that realise the same Application Services or Capabilities. In addition, you can see whether there is need for action with regard to the listed Application Components.
Lifecycle Insights
Lifecycle Information
This timeline shows the lifecycle of the Application Component. You can see at a glance:
When the implementation of the Application Component starts
When the Application Component becomes productive
When the Application Component is decommissioned
Below the timeline, the current value of the attributes Lifecycle State and Investment strategy is displayed.
Data Insights
Information Flow (Network Diagram)
This network diagram shows the information flow between Application Components. The following paths are evaluated:
Application Component
>Composed of>Application Interface>Accesses>Business Object or Data ObjectApplication Component
<Served by<Application Interface>Accesses>Business Object or Data Object
Business Objects, Data Objects and Application Components are represented as nodes. The arrow direction indicates whether the Application Component is referenced from a used (incoming arrow) or provided (outgoing arrow) Application Interface.
The "Revenue Accounting System (RAC)" application uses an interface of the "Bank Equity System (BEQ)" application through which the data "Share" flows. That means: The "Share" data flows from the "Bank Equity System (BEQ)" application to the "Revenue Accounting System (RAC)" application.
The following options are available:
Drag a node to where you want it.
Click a node to only show directly connected objects.
Double-click a node to open the Notebook of the object.
Information Flow (Table)
For all Business Objects or Data Objects which are connected to the Application Component through Application Interfaces, this table shows the current value of the following attributes:
Responsible business actors
Confidentiality
Integrity
Availability
Technology Insights
Technology Roadmap Status
The pie chart in this widget shows you at a glance the current Roadmap status of the System Software elements used by this Application Component.
By clicking a segment of the pie, you can highlight the corresponding System Software elements in the Serving System Software Elements list.
Serving System Software Elements
The table comprises all System Software elements which are used by the Application Component, and lists their attribute Roadmap status.
Quick Access
The quick access area allows you to further explore details you are interested in.
Insights Dashboard for Capabilities [ArchiMate Library]
This dashboard consists of the following areas:
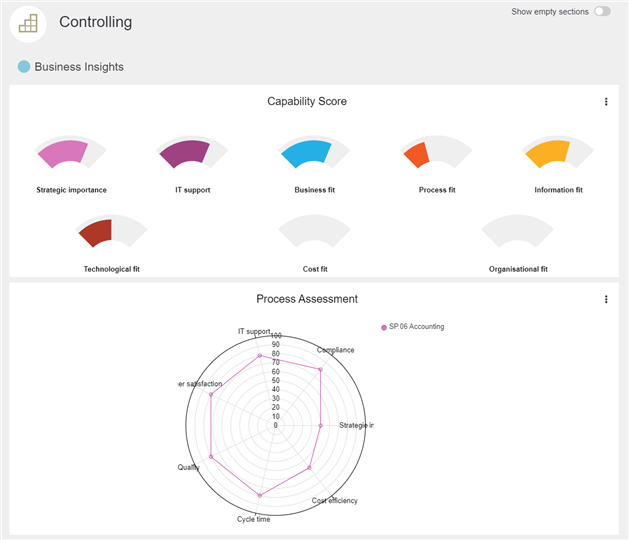
Header
The header is the area along the top of the dashboard. The name of the Capability you are interested in is shown here.
Beneath the name, ADOIT shows you tags for all Grouping elements that aggregate this Capability. The tag colour can be set via the Tag colour attribute of the Groupings.
Business Insights
Capability Score
This gauge chart shows the current value of the following attributes of the Capability (one gauge for each attribute):
Strategic importance
IT support
Business fit
Process fit
Information fit
Technological fit
Cost fit
Organisational fit
Process Assessment (Radar Chart)
For all Business Processes which realise the Capability, this radar chart shows the current value of the following attributes:
Strategic importance
Cost efficiency
Cycle time
Quality
Customer satisfaction
IT support
Compliance
Process Assessment (Table)
For all Business Processes which realise the Capability, this table lists the following attributes:
Strategic importance
Cost efficiency
Cycle time
Quality
Customer satisfaction
IT support
Compliance
Application Insights
Application Lifecycle State (Pie Chart)
The pie chart in this widget shows you at a glance the current Lifecycle state of the Application Components which realise the Capability.
By clicking a segment of the pie, you can highlight the corresponding Application Components in the Application Lifecycle State table.
Application Lifecycle State (Table)
The table comprises all Application Components which realise the Capability, and lists their attribute Lifecycle state.
Application Fitness
For all Application Components which realise the Capability, this radar chart shows the current value of the following attributes:
Business fit
IT fit
Cost fit
Business continuity fit
Security fit
Transformation Insights
Work Packages
This table lists all projects which realise the Capability. The following path is evaluated:
- Capability
<Realized by<Work Package (attribute Specialisation = Project)
All in all, the following attributes are listed for each Work Package:
Specialisation
Risk
Priority
Budget
Data Insights
Required Business Objects
For all Business Objects which realise the Capability, this table shows the current value of the following attributes:
Responsible business actors
Confidentiality
Integrity
Availability
Quick Access
The quick access area allows you to further explore details you are interested in.
Insights Dashboard for Business Objects [ArchiMate Library]
This dashboard consists of the following areas:
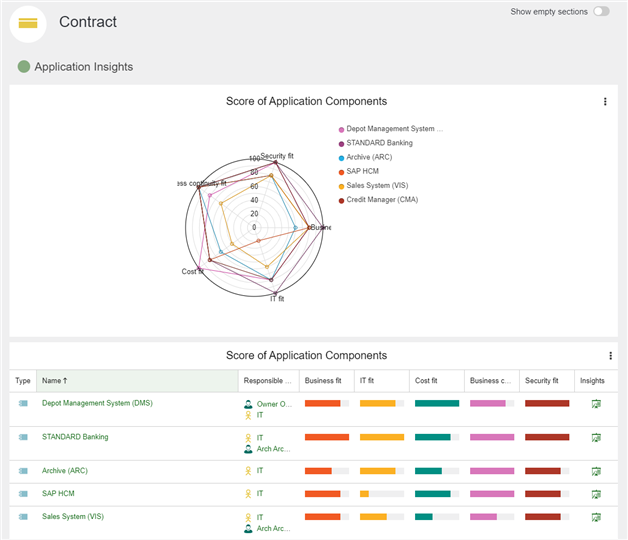
Header
The header is the area along the top of the dashboard. The name of the Business Object you are interested in is shown here.
Beneath the name, ADOIT shows you tags for all Grouping elements that aggregate this Business Object. The tag colour can be set via the Tag colour attribute of the Groupings.
Application Insights
Score of Application Components (Radar Chart)
For all Application Components which access the Business Object, this radar chart shows the current value of the following attributes:
Business fit
IT fit
Cost fit
Business continuity fit
Security fit
Score of Application Components (Table)
For all Application Components which access the Business Object, this table lists the following attributes:
Responsible business actors
Business fit
IT fit
Cost fit
Business continuity fit
Security fit
Data Manipulation and Mastership
For all Application Components which access the Business Object, this table shows whether they read, write or read & write the Business Object. The attribute Access type of the relation Access is evaluated for this purpose.
In addition, you can see whether an Application Component is considered as Master of the Business Object. If the Application Component can write data without being the Master of the Business Object, an exclamation mark is displayed in the Violation column.
Data Flows via Application Interfaces (Network Diagram)
This network diagram shows the information flow between Application Components. The following paths are evaluated:
Business Object
<Accessed by<Application Interface<Part of<Application ComponentBusiness Object
<Accessed by<Application Interface>Serves>Application Component
Business Objects and Application Components are represented as nodes. The Application Interfaces connecting the nodes are shown as branches. The arrow direction indicates whether the Application Component is referenced from a used (incoming arrow) or provided (outgoing arrow) Application Interface.
The "Revenue Accounting System (RAC)" application uses an interface of the "Bank Equity System (BEQ)" application through which the data "Share" flows. That means: The "Share" data flows from the "Bank Equity System (BEQ)" application to the "Revenue Accounting System (RAC)" application.
The following options are available:
Drag a node to where you want it.
Click a node to only show directly connected objects.
Double-click a node to open the Notebook of the object.
Business Insights
Security Requirements
This gauge chart shows the current value of the following attributes of the Business Object (one gauge for each attribute):
Confidentiality
Integrity
Availability
Quick Access
The quick access area allows you to further explore details you are interested in.
Insights Dashboard for System Software Elements [ArchiMate Library]
This dashboard consists of the following areas:
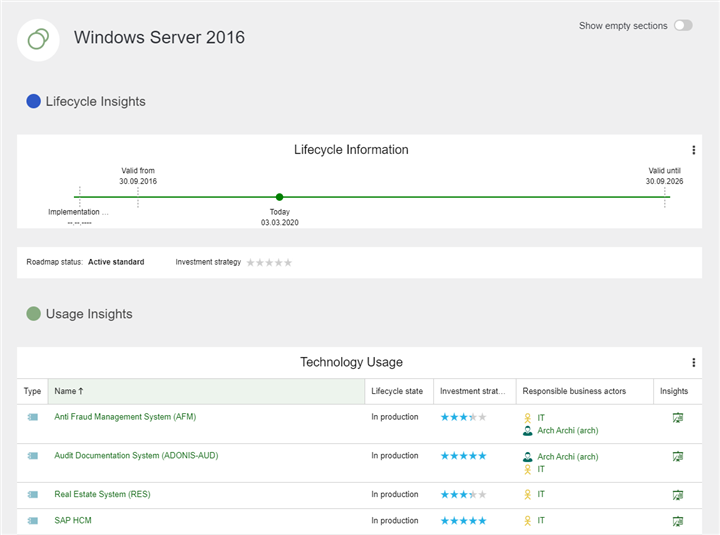
Header
The header is the area along the top of the dashboard. The name of the System Software you are interested in is shown here.
Beneath the name, ADOIT shows you tags for all Grouping elements that aggregate this System Software. The tag colour can be set via the Tag colour attribute of the Groupings.
Lifecycle Insights
Lifecycle Information
This timeline shows the lifecycle of the System Software. You can see at a glance:
When the implementation of the System Software starts
When the System Software becomes productive
When the System Software is decommissioned
Below the timeline, the current value of the attributes Roadmap status and Investment strategy is displayed.
Technology Insights
Alternative Technologies
This table helps you detect alternative System Software elements. It lists all other System Software elements in the same Category. The following path is evaluated:
- System Software (= starting point)
>Specialized from>System Software (attribute Specialisation = Category)<Specialized by<System Software (= listed alternative technologies)
"Oracle", "SQL Server" and "DB2" can be classified as tools in the "Databases" category.

If you look at the Insights dashboard of the "Oracle" System Software, "SQL Server" and "DB2" appear as alternative technologies.
All in all, the following attributes are listed for each System Software:
Category
Action required
Investment strategy
Valid from
Valid until
Responsible business actors
In the last column, you can see the Assigned applications for each alternative System Software element. The following path is evaluated:
- System Software (= listed alternative technologies)
>Serves>Application Component (= assigned applications)
Replaced by
For all System Software elements which replace the current System Software, this table lists the following attributes:
Investment strategy
Valid from
Valid until
Responsible business actors
Usage Insights
Technology Usage
This widget lists all other System Software elements that are used by the System Software currently being viewed. The following path is evaluated:
- System Software
>Realizes or Serves>System Software
All in all, the following attributes are listed for each System Software:
Lifecycle state
Investment strategy
Responsible business actors
Quick Access
The quick access area allows you to further explore details you are interested in.
Insights Dashboard for Applications [Standard Library]
This dashboard consists of the following areas:
Application Insights
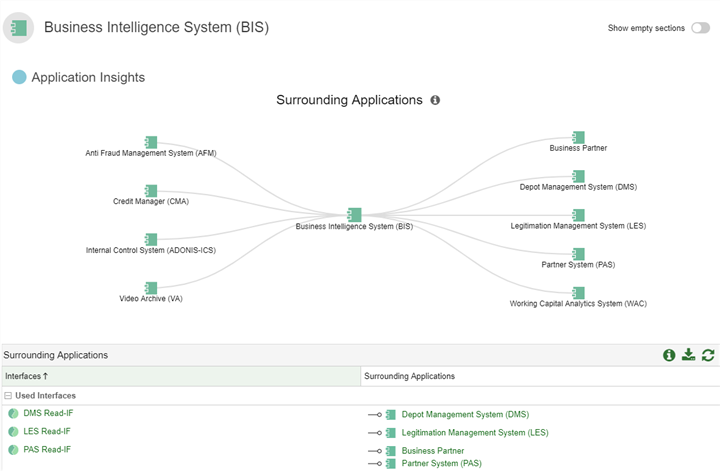
Surrounding Applications (Tree Diagram)
This widget shows surrounding Applications that use or provide Interfaces to the Application currently being viewed.
Each node represents an Application. The centre node is the Application you are interested in. The Interfaces connecting the Applications are shown as branches, with the Provided Interfaces to the left and the Used Interfaces to the right.
The following options are available:
- Click a node title to open the Notebook of the object.
Surrounding Applications (Table)
This table lists the provided and used Interfaces of the Application and the Applications that are connected to these Interfaces.
Application Score
This gauge chart shows the current value of the following attributes of the Application (one gauge for each attribute):
Strategic Importance
Business Fit
IT Fit
Cost Fit
Business Continuity Fit
Security Fit
Redundancy Analysis
This table helps you detect redundant Applications. It lists all other Applications that provide the same Business Functions. In addition, you can see whether there is need for action with regard to the listed Applications.
Lifecycle Insights
Lifecycle Information
This timeline shows the lifecycle of the Application. You can see at a glance:
When the implementation of the Application starts
When the Application becomes productive
When the Application is decommissioned
Below the timeline, the current value of the attributes Lifecycle State and Investment Strategy is displayed.
Data Insights
Information Flow (Network Diagram)
This network diagram shows the information flow between Applications. The following paths are evaluated:
Application
>Provided Interfaces>Interface>Transferred Business Objects>Business ObjectApplication
>Used Interfaces>Interface>Transferred Business Objects>Business Object
Business Objects and Applications are represented as nodes. The arrow direction indicates whether the Application is referenced from a used (incoming arrow) or provided (outgoing arrow) Interface.
The "STANDARD Banking" application uses an interface of the "Business Partner" application through which the data "Partner address" and "Partner" flows. That means: The "Partner Address" and "Partner" data flows from the "Business Partner" application to the "STANDARD Banking" application.
The following options are available:
Drag a node to where you want it.
Click a node to only show directly connected objects.
Double-click a node to open the Notebook of the object.
Information Flow (Table)
For all Business Objects which are connected to the Application through Interfaces, this table shows the current value of the following attributes:
Responsible Person
Confidentiality
Integrity
Availability
Technology Insights
Technology Roadmap Status of Used Technologies
The pie chart in this widget shows you at a glance the current Technology Roadmap Status of the Technologies used by this Application.
By clicking a segment of the pie, you can highlight the corresponding Technologies in the Used Technologies list.
Used Technologies
The table comprises all Technologies which are used by the Application, and lists their attribute Technology Roadmap Status.
Quick Access
The quick access area allows you to further explore details you are interested in.
Insights Dashboard for Business Capabilities [Standard Library]
This dashboard consists of the following areas:
Business Insights
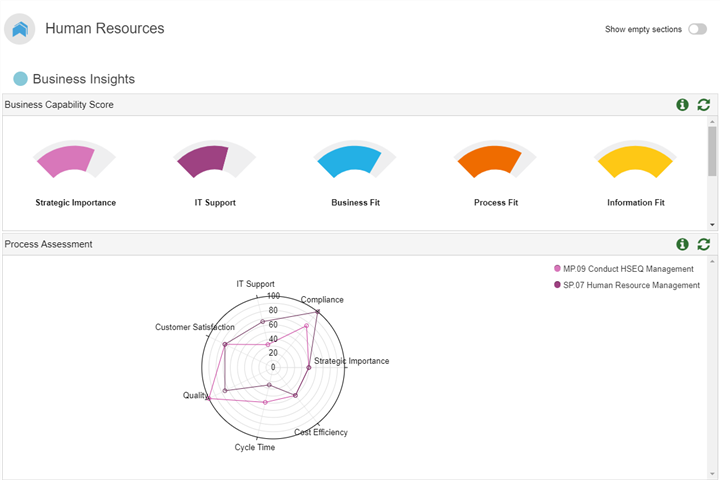
Business Capability Score
This gauge chart shows the current value of the following attributes of the Business Capability (one gauge for each attribute):
Strategic Importance
IT Support
Business Fit
Process Fit
Information Fit
Technological Fit
Cost Fit
Organisational Fit
Process Assessment (Radar Chart)
For all Business Processes which support the Business Capability, this radar chart shows the current value of the following attributes:
Strategic Importance
Cost Efficiency
Cycle Time
Quality
Customer Satisfaction
IT Support
Compliance
Process Assessment (Table)
For all Business Processes which support the Business Capability, this table lists the following attributes:
Strategic Importance
Cost Efficiency
Cycle Time
Quality
Customer Satisfaction
IT Support
Compliance
Application Insights
Application Lifecycle State (Pie Chart)
The pie chart in this widget shows you at a glance the current Lifecycle State of the Applications which support the Business Capability.
By clicking a segment of the pie, you can highlight the corresponding Applications in the Application Lifecycle State table.
Application Lifecycle State (Table)
The table comprises all Applications which support the Business Capability, and lists their attribute Lifecycle State.
Application Fitness
For all Applications which support the Business Capability, this radar chart shows the current value of the following attributes:
Business Fit
IT Fit
Cost Fit
Business Continuity Fit
Security Fit
Transformation Insights
Project Size
This bar chart displays the budgets of all Projects which introduce, change or retire the Business Capability.
Projects
For all Projects which introduce, change or retire the Business Capability, this table lists the following attributes:
Risk
Priority
Budget
Cost of Strategic Demands
This bar chart displays the costs of all Demands which affect the Business Capability.
Strategic Demands
For all Demands which affect the Business Capability, this table lists the following attributes:
Risk
Estimated Cost
Priority
Demand Status
Processed Demands (= Related Projects)
Data Insights
Required Business Objects
For all Business Objects which support the Business Capability, this table shows the current value of the following attributes:
Responsible Person
Confidentiality
Integrity
Availability
Organisational Insights
Required Organisational Units
The table comprises all Organisational Units which support the Business Capability, and lists their attribute Responsible Person.
Quick Access
The quick access area allows you to further explore details you are interested in.
Insights Dashboard for Business Objects [Standard Library]
This dashboard consists of the following areas:
Application Insights
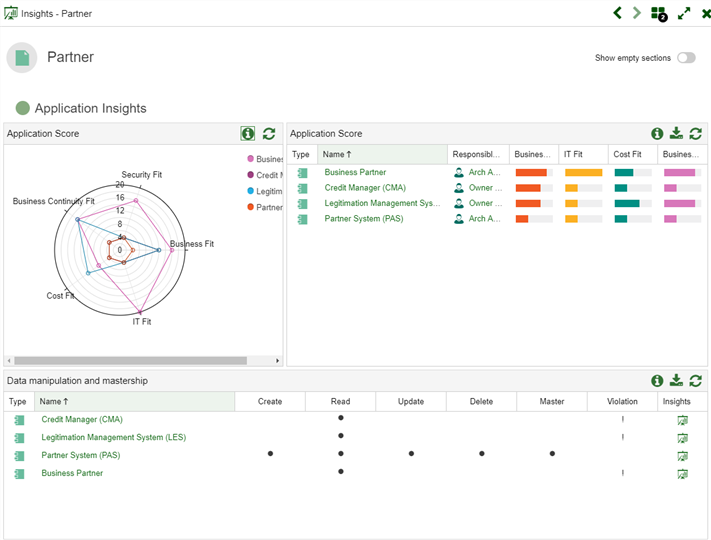
Application Score (Radar Chart)
For all Applications which are assigned to the Business Object, this radar chart shows the current value of the following attributes:
Business Fit
IT Fit
Cost Fit
Business Continuity Fit
Security Fit
Application Score (Table)
For all Applications which are assigned to the Business Object, this table lists the following attributes:
Responsible Person
Business Fit
IT Fit
Cost Fit
Business Continuity Fit
Security Fit
Data Manipulation and Mastership
For all Applications which are assigned to the Business Object, this table shows whether they create, read, update or delete (CRUD) the Business Object. The attributes of the relation Referenced Business Objects are evaluated for this purpose.
In addition, you can see whether an Application is considered as Master of the Business Object. If the Application can create, update or delete data without being the Master of the Business Object, an exclamation mark is displayed in the Violation column.
Data Flows (Network Diagram)
This network diagram shows the information flow between Applications. The following paths are evaluated:
Business Object
>Transferred Business Object>Interface>Provided Interfaces>ApplicationBusiness Object
>Transferred Business Object>Interface>Used Interfaces>Application
Business Objects and Applications are represented as nodes. The arrow direction indicates whether the Application is referenced from a used (incoming arrow) or provided (outgoing arrow) Interface.
The "STANDARD Banking" application uses an interface of the "Business Partner" application through which the data "Partner address" and "Partner" flows. That means: The "Partner Address" and "Partner" data flows from the "Business Partner" application to the "STANDARD Banking" application.
The following options are available:
Drag a node to where you want it.
Click a node to only show directly connected objects.
Double-click a node to open the Notebook of the object.
Business Insights
Security Requirements
This gauge chart shows the current value of the following attributes of the Business Object (one gauge for each attribute):
Confidentiality
Integrity
Availability
Quick Access
The quick access area allows you to further explore details you are interested in.
Insights Dashboard for Technologies [Standard Library]
This dashboard consists of the following areas:
Lifecycle Insights
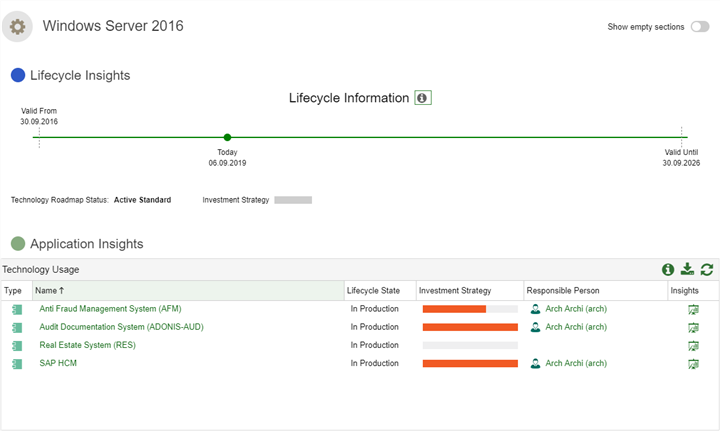
Lifecycle Information
This timeline shows the lifecycle of the Technology. You can see at a glance:
When the validity period of a Technology starts
When the Technology reaches the end of its validity period
Below the timeline, the current value of the attributes Technology Roadmap Status and Investment Strategy is displayed.
Technology Insights
Alternative Technologies
This table helps you detect alternative Technologies. It lists all other Technologies of the same Type. The following path is evaluated:
- Technology (= starting point)
>Type>Technology<Type<Technology (= listed alternative technologies)
All in all, the following attributes are listed for each Technology:
Action Required
Investment Strategy
Valid From
Valid Until
Responsible Person
Assigned Applications
Type
Replaced by
For all Technologies which replace the current Technology, this table lists the following attributes:
Investment Strategy
Valid From
Valid Until
Responsible Person
Usage Insights
Technology Usage
For all Applications, Interfaces and Infrastructure Elements which use the Technology, this table lists the following attributes:
Lifecycle State
Investment Strategy
Responsible Person
Quick Access
The quick access area allows you to further explore details you are interested in.
Quick Access (All Insights Dashboards)
You can perform the following actions on an Insights dashboard:
BIA [all except Capabilities & System Software elements]
Analyse and visualise dependencies between objects across multiple layers.
Interface Report [Application Components & Applications only]
Visualise the interfaces of an application.
References
Show references of objects.
Usage in Models
Show models in which the object is used.
Gantt [all except Business Objects, Capabilities & Business Capabilities]
Visualise object information using various Gantt charts.
CRUD [ Business Objects only]
Show which applications create, read, update, or delete a business object.
Analyse Dependencies
Navigate through connected objects by following the relations.
Validation
Verify that an object complies with various guidelines and best practices.