Working with Views
The following sections provide an overview of the most important functions for working with views.
Available Views
Views enable you to visualize — and in some cases even edit — object attributes or relations between objects in ADOIT. They can be generated using the following starting points:
Reporting Board
Model Catalogue
Object Catalogue
Graphical editor
Tabular editor
Query result
Reference entry within a Notebook
Opened views in ADOIT
There are five types of views in ADOIT:
All views provide the possibility to capture and / or maintain visualized elements and values. Changes are updated in the respective view immediately. If relations are modified between the displayed objects the view can be refreshed by clicking Update all relations in the context menu.
The provision of views depends on the configuration of your ADOIT installation. Further views can be configured in the Administration Toolkit.
Visualize Relations of the Enterprise Architecture with the Matrix View
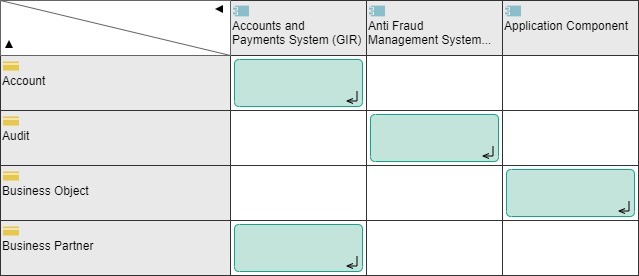
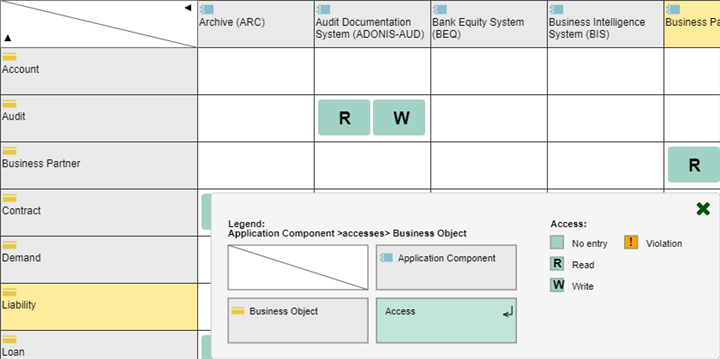
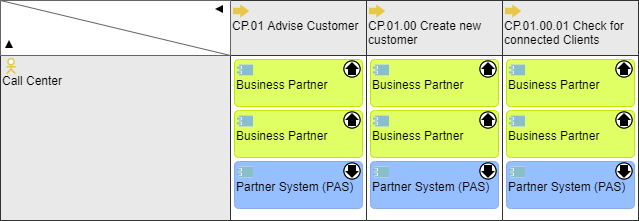
The Matrix View is used to show explicit and implicit dependencies between architectural objects (e.g. business processes, applications and organisational units). The Matrix View can be applied to visualise the connection of two levels of the metamodel. The links can be, for example, the technologies in use of the applications.
Compare Objects with the Portfolio View
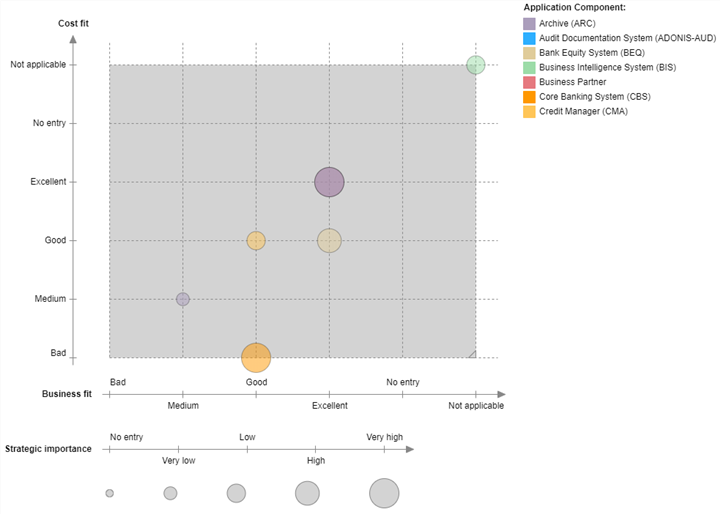
In a Portfolio View objects can be compared by using up to three attributes. For managing a portfolio the Portfolio View offers a concise way to evaluate portfolio elements.
A possible use case is the evaluation of an application portfolio based on investment costs, business fitness and operational costs.
Visualise Cross-Layer Dependencies with the BIA View (Dependency Analysis)
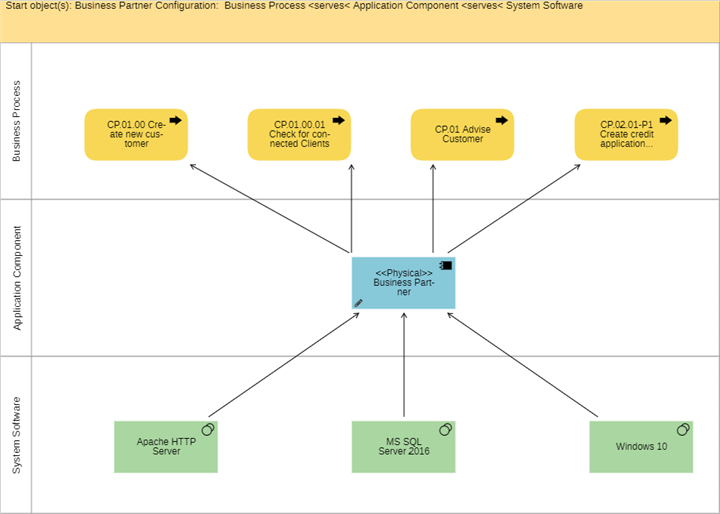
The BIA (Dependency Analysis) facilitates the visualisation of (critical) connections and dependencies across multiple architectural layers. A possible use case is to show which architectural objects have direct or indirect impact on business processes.
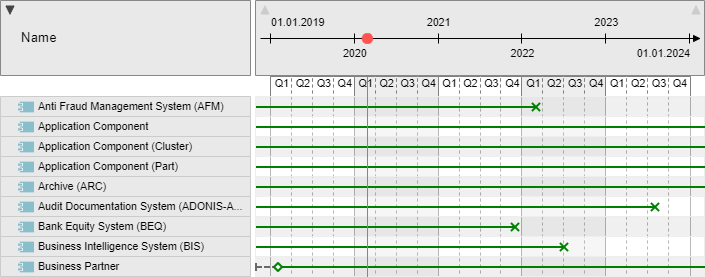
Compare Objects with the Gantt View
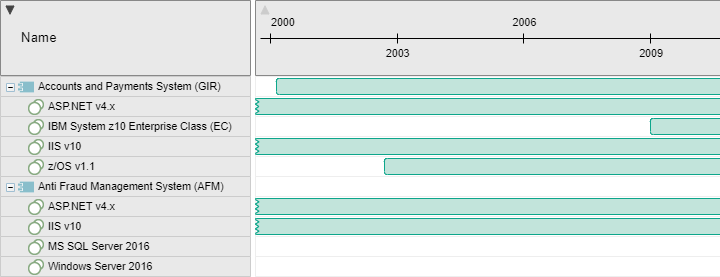
In a Gantt View single attributes of architectural objects can be compared, either directly or in an aggregated form. The Gantt View provides a quick orientation by using simple, intuitive data visualisation.
One possible use case is the visualisation of the lifecycles of applications which are depicted as horizontal bars together with a timeline.
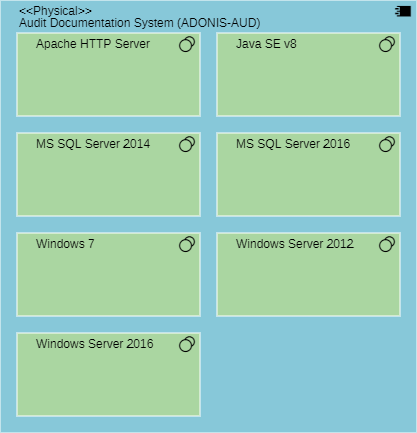
Visualise Hierarchies and Relations between Objects in a Cluster Map
Cluster Maps in ADOIT visualise hierarchies and relations between objects. The cluster map must be configured in the Administration Toolkit before it is available in the web client. Many different hierarchies can be easily displayed using different configurations.
The Matrix View
Follow these steps to create a Matrix View:
Select the objects or the model to be shown on one axis in the Matrix View.
Right-click the selection, point to Reports, and then click Matrix. A support dialogue opens.
Choose the desired Matrix View configuration (selection criteria depend on both the selected objects and the options pre-configured in the Administration Toolkit).
The Matrix View is generated. The Matrix View will automatically add all objects which have a relation to the earlier selected objects according to the Matrix View configuration.
In addition to the standard view certain matrix configurations support additional viewing options.
Expand Matrix View Manually
- Drag additional objects from the Explorer into the Matrix View. The legend shows you which objects can be used.
If you cannot insert objects, contact your ADOIT administrator to enable the option in the Administration Toolkit.
Complete Matrix
To automatically complete a Matrix View:
- Click the Complete matrix button
 .
.
The Matrix View will automatically add all objects which have a relation to the currently visible set of objects according to the Matrix View configuration.
Modify Relations between Objects
If relations between objects are being modified, all changes will become effective immediately in the corresponding objects. Depending on the type of the matrix there are several options for modifying the relations between the objects.
Matrix Views that contain modelling objects are read-only. You cannot edit the relations between the objects in such Matrix Views.
Modify Relations in a 3-dimensional Matrix
In a 3-dimensional matrix relational objects are displayed in the cells. You have the following options for modifying relations:
Add Cell Objects
- Add new objects to the Matrix View by drag and drop or via the context menu item Create <object type>.
Delete Cell Objects
- Delete cell objects and also the corresponding objects on each axis via the context menu item Remove from cell.
All newly added or deleted relations are also added or deleted in the corresponding Notebooks of the affected object.
Modify Relations in a 2-dimensional Matrix
In a 2-dimensional matrix objects in a cell represent a relation between the objects on each axis. You have the following options for modifying relations:
Create Relation
- Select context menu - Create relation.
Remove Relation
- Select context menu - Remove relation.
All newly added or deleted relations are also added or deleted in the corresponding Notebooks of the affected object.
Change Visualisation
Change the visualisation of the view upon predefined criteria:
- Click the Change visualisation button
 , and then select the desired
visualisation.
, and then select the desired
visualisation.
Different values of an attribute which is shared by objects in a Matrix View can be displayed in a heat map. The values will be coloured and marked with a matching symbol according to the configuration to e.g. indicate an investment strategy for applications.
Heat map features are dependent on the Application Library and product configuration.
Adjust View
Adjust the view to display or hide columns and rows without cell objects. In a 3-dimensional Matrix View you can also highlight cell objects which occur multiple times:
- Click the Adjust view button
 , and then select the desired
setting.
, and then select the desired
setting.
Export View
In order to export the view as an Excel spreadsheet (XLSX format), PDF or image file (PNG format):
- Click the Export button
 , and
then select an export format.
, and
then select an export format.
In all three formats, the graphical representation of the view and the legend are exported. Additionally, when exporting an Excel spreadsheet, the objects and relations included in the view are listed on a separate sheet. When exporting a PDF, you can select the page layout and the page orientation.
Due to technical limitations of the browser, when exporting a very large Matrix View as an Excel spreadsheet, the graphical representation may not be included.
Save View
There are two different scenarios:
Save as Model
Matrix Views based on objects can be saved as a model. Click the Save as model button
 .
.Save changes
To save changes to a Matrix View based on a model, click the Save changes button
 .
.
If you cannot save the Matrix view, contact your ADOIT administrator to enable the option in the Administration Toolkit.
The Portfolio View
Follow these steps to create a Portfolio View:
Select the objects or the model to be displayed in the Portfolio View.
Right-click the selection, point to Reports, and then click Portfolio. A support dialogue opens.
Choose the desired Portfolio View configuration (selection criteria depend on both the selected objects and the options pre-configured in the Administration Toolkit).
Expand Portfolio View
To manually expand the Portfolio View:
- Drag additional objects from the Explorer into the Portfolio View. The legend shows you which objects can be used.
New objects will be positioned according to the existing objects in the view.
Adjust View
Adjust the view to activate or deactivate tooltips, invert the x-axis and y-axis and to display or hide the legend and bubble slices.
- Click the Adjust view button
, and then select the desired
setting.
Export View
In order to export the view as an Excel spreadsheet (XLSX format), PDF or image file (PNG format):
- Click the Export button , and
then select an export format.
Save View
There are two different scenarios:
Save as Model
Portfolio Views based on objects can be saved as a model. Click the Save as model button
.Save changes
To save changes to a Portfolio View based on a model, click the Save changes button
.
The BIA View (Dependency Analysis)
Follow these steps to create a BIA View:
Select the objects or the model to be displayed in the BIA View.
Right-click the selection, point to Reports, and then click BIA. A support dialogue opens.
Choose the desired BIA View configuration (selection criteria depend on both the selected objects and the options pre-configured in the Administration Toolkit).
The Gantt View
Follow these steps to create a Gantt View:
Select the objects or the model to be displayed in the Gantt View.
Right-click the selection, point to Reports, and then click Gantt. A support dialogue opens.
Choose the desired Gantt View configuration (selection criteria depend on both the selected objects and the options pre-configured in the Administration Toolkit).
Expand Gantt View
To manually expand the Gantt View:
- Drag additional objects from the Explorer into the Gantt View. The legend shows you which objects can be used.
The new objects will be added at the bottom of the view.
Change Visualisation
Change the visualisation of the view upon predefined criteria:
- Click the Change visualisation button
, and then select the desired
visualisation.
Application Planning
A changed visualisation is available for Gantt Views based on the following configurations:
ArchiMate Application Library: "Application Component Roadmap"
ADOIT Standard Application Library: "Application Roadmap (Applications)" respectively "Application Roadmap (Domains - Applications)"
When you create such a view, the visualisation option "Application Planning" is selected by default. This visualisation shows the lifecycle of applications (Application Components or Applications) in great detail. Multiple attributes are displayed for each bar (= object). This allows you to see at a glance:
When the implementation of an application starts
When an application becomes productive
When an application is decommissioned
When an application replaces another
The availability of these views depends on the Application Library and product configuration.
Technology Planning
A changed visualisation is available for Gantt Views based on the following configurations:
ArchiMate Application Library: "System Software Roadmap"
ADOIT Standard Application Library: "Technology Roadmap" respectively "Application - Technology Roadmap"
When you create such a view, the visualisation option "Technology Planning" is selected by default. This visualisation shows the lifecycle of technologies (System Software or Technologies) in great detail. Multiple attributes are displayed for each bar (= object). This allows you to see at a glance:
When the implementation of a technology starts
When a technology becomes productive
When a technology is decommissioned
When a technology replaces another
In case of "Application - Technology Roadmaps", the additional visualisation option "Technology Usage" is available. This visualisation shows the actual duration of use of Technologies by specific Applications.
The availability of these views depends on the Application Library and product configuration.
Adjust View
Adjust the view to activate or deactivate tooltips and to display or hide attribute values.
- Click the Adjust view button
, and then select the desired
setting.
Similarly, in the Gantt View, alphabetical sorting and sorting by the attribute values is possible:
- Click the arrow icon in the header of the column you want to sort by.
Export View
In order to export the view as an Excel spreadsheet (XLSX format), PDF or image file (PNG format):
- Click the Export button , and
then select an export format.
Save View
There are two different scenarios:
Save as Model
Gantt Views based on objects can be saved as a model. Click the Save as model button
.Save changes
To save changes to a Gantt View based on a model, click the Save changes button
.
The Cluster Map
Follow these steps to create a Cluster Map:
Select the objects to be displayed in the Cluster Map or the model template (= the source model).
Right-click the selection, point to Reports, and then click Cluster Map. A support dialogue opens.
Choose the desired Cluster Map configuration (selection criteria depend on both the selected objects and the options pre-configured in the Administration Toolkit).
Confirm with OK.
Optionally you can also:
Adjust the evaluation path of the Cluster Map.
Use a model template.
Adjust Evaluation Path
When you select objects (e.g. in a model or in the Object Catalogue) and generate a Cluster Map, you can adjust the number of displayed objects.
Cluster Maps with a reduced evaluation path decrease the number of displayed objects. Only objects that have a relation to the earlier selected objects are displayed. This relation must be defined in the Cluster Map configuration.
Cluster Maps with a reduced evaluation path (top down) decrease the number of displayed objects even further. Only objects that both have a relation to the earlier selected objects and are lower in the hierarchy of the Cluster Map are displayed.
The provision of path evaluation options depends on the configuration of your ADOIT installation.
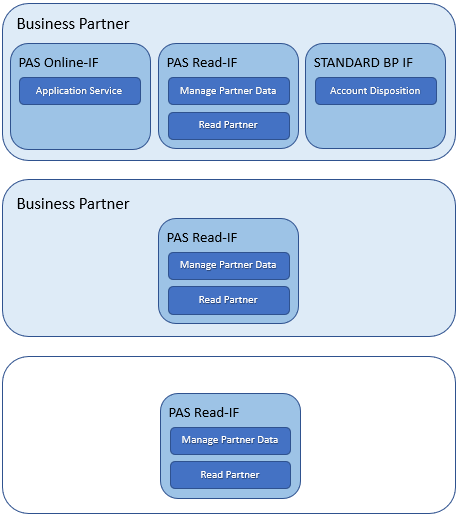
The application "Business Partner" is composed of the three interfaces "PAS Online-IF", "PAS Read-IF" and "STANDARD BP IF".
Each interface is assigned to some services. In particular, the interface "PAS Read-IF" is assigned to the following two services: "Manage Partner Data" and "Read Partner".
The following configuration was defined in the Administration Toolkit before: "Application Component -> Application Interface -> Application Service". When generating a cluster map (full or reduced evaluation path) from the object "PAS Read-IF", the following objects will be displayed in the Cluster Map:
Use Model Template
The option „Use model template“ can be activated when generating a Cluster Map. The selection of a template enables you to represent the objects in the Cluster Map according to a specific graphical structuring. When you generate a Cluster Map on a model that is already the case. Therefore, this option is only available when you generate a Cluster Map on an object.
Create Model Template
Set a specific layout for a cluster map with a model template. To do this you have to be familiar with the Cluster Map configuration. In order to create a model template:
Create a new model with a meaningful name.
noteSelect the model type according to the configuration if your Application Library contains different model types (e.g. ADOIT Standard Application Library). Usually this should be an Analysis Model.
Place all objects of the first layer which should be displayed in the Cluster Map on the drawing area. To do this use drag and drop from the Object Catalogue. Select the object type according to the configuration.
Double-click the objects on the drawing board to open their Notebooks.
In the chapter "Representation", deactivate the option Display as Icon. The objects will now appear on the drawing area as rectangles of modifiable size.
Adjust the size and alignment of the objects to specify the layout you have in mind.
Click the Save button
in the
menu bar of the open model.
Optionally you can also:
- Repeat steps 2 - 5 for the objects of the layers below the first layer, if you want to set a specific layout for them as well. Place the objects entirely on those objects of the layer above they have a relation with according to the configuration.
Only place objects of the layers below the first layer, if they have a relation to other objects in the model template which is defined both in their notebooks and the configuration.