Insights Dashboards
An Insights dashboard displays essential information about a specific object in your organisation, and has a quick access area for key features.
Insights Dashboard vs. Notebook
An Insights dashboard summarizes the most important information about an object, such as aggregated data, information about referenced objects with charts etc. This information is presented in an easily understandable and visually appealing way. The Notebook, on the other hand, is a dedicated tool for editing and reading master data and contains no graphics. The Notebook is for data management, while an Insights dashboard is for reading and analysis.
Types of Insights Dashboards
The availability of Insights dashboards depends on the application library. In the ArchiMate Application Library, Insights dashboards are available for every type of repository object. All dashboards contain the same set of default widgets that provide the user with summary data about the object. Some dashboards also have additional widgets.
Default Widgets for all Insights Dashboards: Find out more about widgets that are available for all Insights dashboards
Additional Widgets for Application Components: Find out more about special widgets available only in the Insights dashboard for Application Components
Additional Widgets for Capabilities: Find out more about special widgets available only in the Insights dashboard for Capabilities
Additional Widgets for Business Objects: Find out more about special widgets available only in the Insights dashboard for Business Objects
Additional Widgets for System Software Elements: Find out more about special widgets available only in the Insights dashboard for System Software elements
Additional Widgets for Plateaus: Find out more about special widgets available only in the Insights dashboard for Plateaus
Additional Widgets for Business Processes: Find out more about special widgets available only in the Insights dashboard for Business Processes
Open Insights Dashboard
To open an Insights dashboard:
- Right-click the object, point to Open, and then click Insights
 .
.
You can open an Insights dashboard this way using e.g. the Explorer or the graphical editor as a
starting point. Additionally, it is possible to open an Insights dashboard directly from the
Notebook by clicking the Insights button
![]() .
.
Edit Attributes
To edit the attributes of the object that is open in the Insights dashboard:
- Click the More button
 at the
top right corner of the Insights dashboard, and then click Properties
at the
top right corner of the Insights dashboard, and then click Properties  .
.
The Notebook opens. If you have write access, you can edit the attributes.
Open in ADONIS
If a ![]() Business Process was
imported from ADONIS into ADOIT, you can directly jump to the original object.
To open the object in ADONIS:
Business Process was
imported from ADONIS into ADOIT, you can directly jump to the original object.
To open the object in ADONIS:
- Click the ADONIS button
 at
the top of the Insights dashboard.
at
the top of the Insights dashboard.
ADONIS opens in a new browser tab. After signing in, the Insights dashboard of the original object opens.
Show/Hide Empty Sections
By default, all areas of an Insights dashboard for which no data is available are hidden. To show or hide empty sections:
- Click the More button at the
top right corner of the Insights dashboard, and then click Show empty sections.
Navigate in an Insights Dashboard
Use the quick links at the top left of the Insights dashboard to jump to the section you want to see:
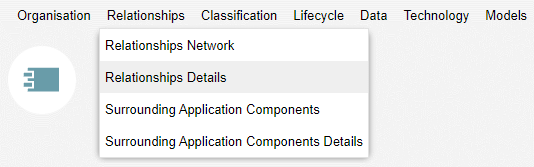
Each link represents a category in the dashboard.
Choose a category first, and then select the widget you want from the drop-down menu.
If the category only holds one widget, the name of the widget is shown instead of the category name.
Share Insights Dashboard
You can generate a URL for an Insights dashboard. This way you can e.g. easily share it with your colleagues via email.
To share an Insights dashboard:
Click the Share button
 at
the top right corner of the Insights dashboard.
at
the top right corner of the Insights dashboard.Now do one of the following:
Share the URL by email. In the Add people box, start typing the username or email address of a user, and then select the one you want when you see it. If the recipient is not a user or has no email address associated, you need to enter the full email address. Add additional recipients as needed. In the Include a message box, you can add a personal message if you want. When you are done, click Share and the message will be sent.
Paste the URL wherever you need it. Click Copy to directly copy the URL to the clipboard, or copy the URL manually from the Copy link box.
Before ADOIT can send emails, the mail settings must be set correctly in the Administration Toolkit.
Available Functions
Across all widgets (= small program windows) of the various Insights dashboards various functions
are available. Click the More button
![]() to access these functions:
to access these functions:
Show a tooltip with information about the widget (icon
 )
)Export the content of a widget as a PDF file or Excel file (XLSX format) (icon
 )
)Refresh a widget to get the latest data (icon
 )
)Filter data in columns to show the elements you want and hide the rest:
Show or hide filters (icon
 )
)Clear all filters (icon
 )
)
Show or hide columns (icon
 )
)
Default Widgets for all Dashboards
Regardless of which object you choose, an Insights dashboard will always contain the default widgets, which are described in detail below.
Some dashboards also have additional widgets. See the sections about Application Components, Capabilities , Business Objects , System Software elements, Plateaus and Business Processes to find out more.
Header
The header is the area along the top of the dashboard.
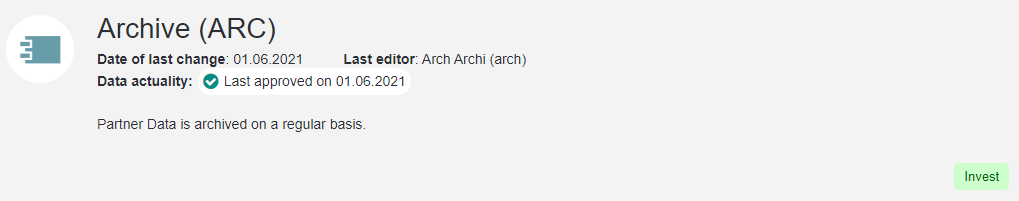
The following information is displayed here:
the name of the object
the Date of last change
the Last editor
an assessment of the Data actuality:
 Green icon stands for
'data is up-to-date'
Green icon stands for
'data is up-to-date' Yellow icon stands for
'data actuality has not been confirmed for 100 days'
Yellow icon stands for
'data actuality has not been confirmed for 100 days' Red icon stands for 'data
actuality has not been confirmed for 200 days'
Red icon stands for 'data
actuality has not been confirmed for 200 days'
Click this icon to confirm the data actuality.
The global thresholds for assessment of data actuality (number of days after which an object is marked 'yellow' or 'red') can be set in the Administration Toolkit.
the Description of the object
tags for all Grouping elements that aggregate this object
The tag colour can be set via the Tag colour attribute of the Groupings.
Involved Users and Business Actors
This table lists all Users and Business Actors which are involved with the currently viewed element.

The following paths are evaluated:
Element
>Responsible business actors>User or Business ActorElement
>Accountable business actors>User or Business ActorElement
>Consulted business actors>User or Business ActorElement
>Informed business actors>User or Business Actor
The table shows the following information:
the responsibilities of the User or Business Actor for the element according to a RACI matrix
for Business Actors only, the Business Roles and Stakeholders they are assigned to
Relationships Network
This network diagram shows the currently viewed element and all related elements.
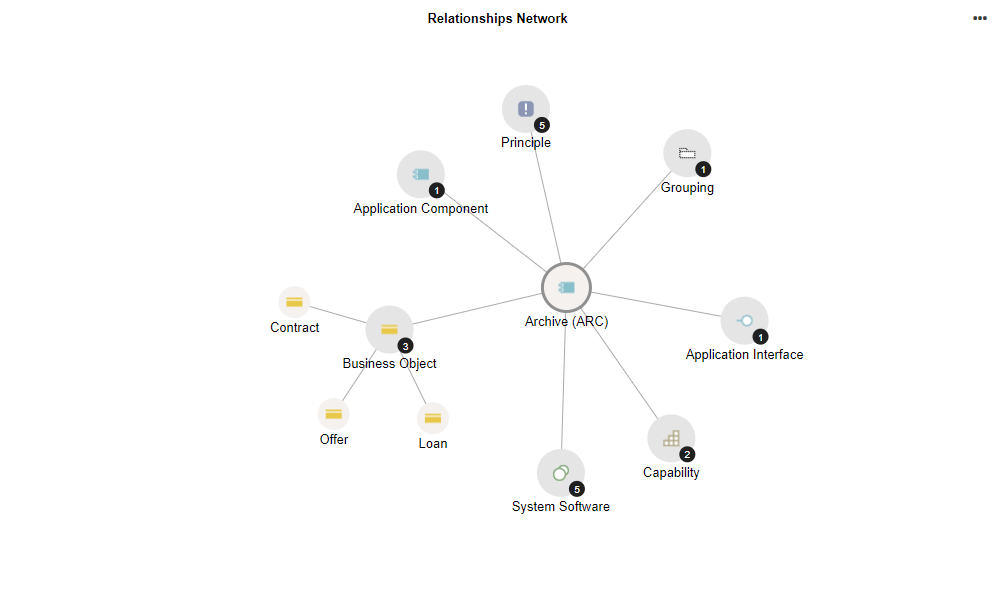
The following paths are evaluated:
Element
>any ArchiMate relationship>'To' elementElement
<any ArchiMate relationship<'From' element
The centre node is the currently viewed element, while the nodes around it represent related elements grouped by type. Click on such a node to show the individual elements.
Relationships Details
This table provides an overview of all related elements of the currently viewed element.
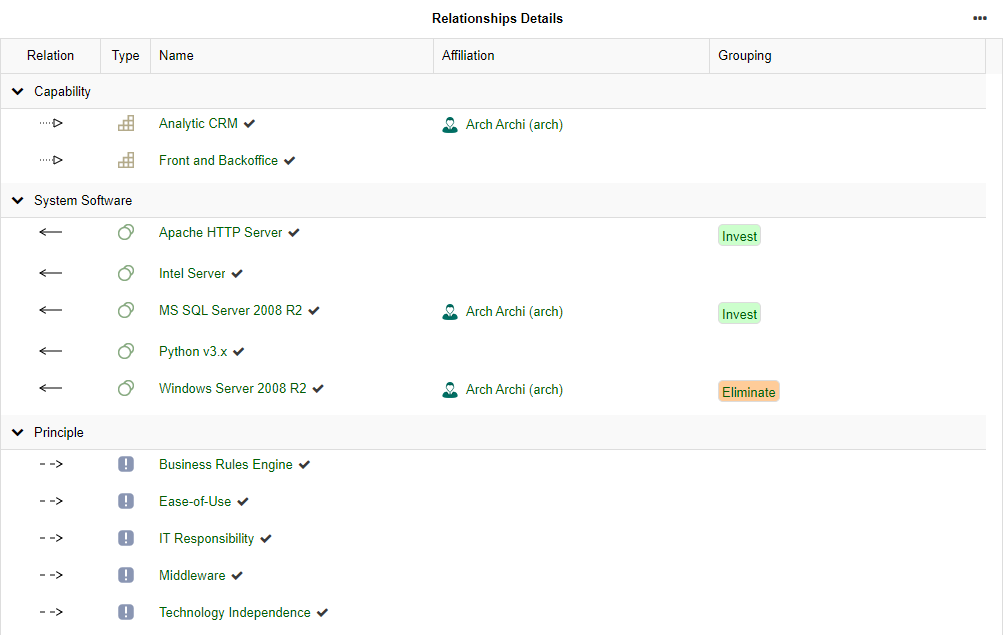
The following paths are evaluated:
Element
>any ArchiMate relationship>'To' elementElement
<any ArchiMate relationship<'From' element
The direction of the relationship is indicated in the first column. Arrows to the left represent incoming relations, and arrows to the right outgoing relations. To display the type of the relationship, move the mouse pointer over the arrow.
In the Affiliation column, you can see all Users and Business Actors which are involved with the listed element according to a RACI matrix.
In the Grouping column, tags for all Grouping elements that aggregate the listed element are shown. The tag colour can be set via the Tag colour attribute of the Groupings.
Timeline
This timeline shows the lifecycle of the currently viewed element.

You can see at a glance:
When the implementation of the element starts [Application Components & System Software elements only]
When the element becomes productive (valid from)
When the element is decommissioned (valid until)
Associated Models
This table shows all models that are associated with the currently viewed element.
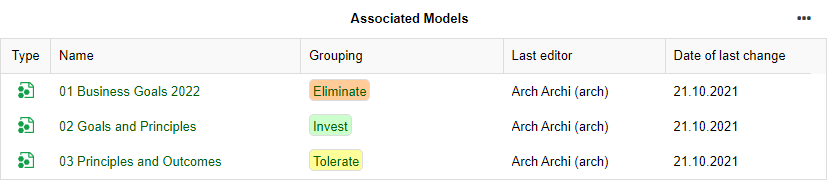
The following path is evaluated:
- Element
>Associated models>Model
The table shows the following information:
the Last editor
the Date of last change
In the Grouping column, tags for all Grouping elements that aggregate the listed model are shown. The tag colour can be set via the Tag colour attribute of the Groupings.
Usage in Models
This table shows all models that contain the currently viewed element.
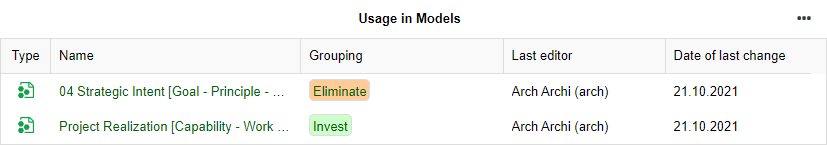
The table shows the following information:
the Last editor
the Date of last change
In the Grouping column, tags for all Grouping elements that aggregate the listed model are shown. The tag colour can be set via the Tag colour attribute of the Groupings.
Quick Access
The quick access area allows you to further explore details you are interested in.

You can perform the following actions:
Analyse Dependencies: Analyse and visualise dependencies between objects across multiple layers.
Validation: Verify compliance with various guidelines and best practices.
Object report: Create a report with all important information about the Organisational Unit.
Interface Report [Application Components only]: Visualise the interfaces of an application.
Additional Widgets for Application Components
The Insights Dashboard for Application Components contains all default widgets and some additional widgets, which are described in detail below.
Surrounding Application Components
This widget shows surrounding Application Components that use or provide Application Interfaces to the Application Component currently being viewed.
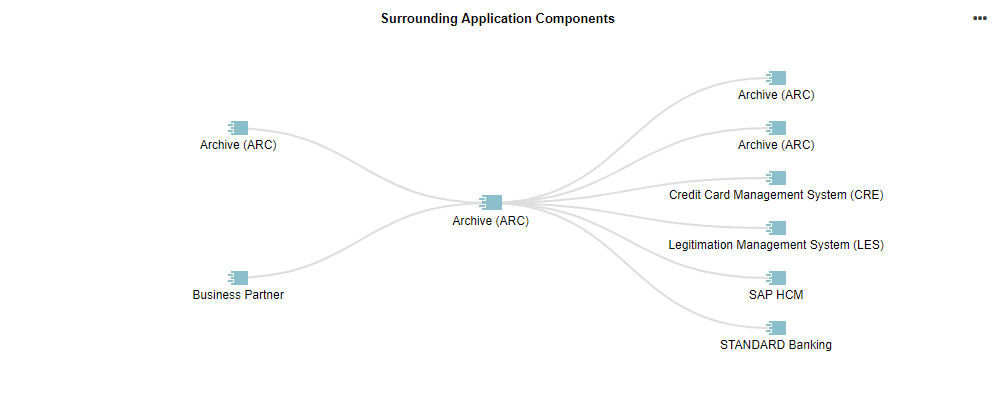
The following paths are evaluated:
Application Component
>Composed of>Application Interface>Serves>Application ComponentApplication Component
<Served by<Application Interface<Part of<Application Component
Each node represents an Application Component. The centre node is the Application Component you are interested in. The Application Interfaces connecting the Application Components are shown as branches, with the provided interfaces (Composition) to the left and the used interfaces (Serving) to the right.
The following options are available:
- Click a node title to open the Notebook of the object.
Surrounding Application Components Details
This table lists the provided and used Application Interfaces of the Application Component and the surrounding Application Components that use or provide these Application Interfaces.
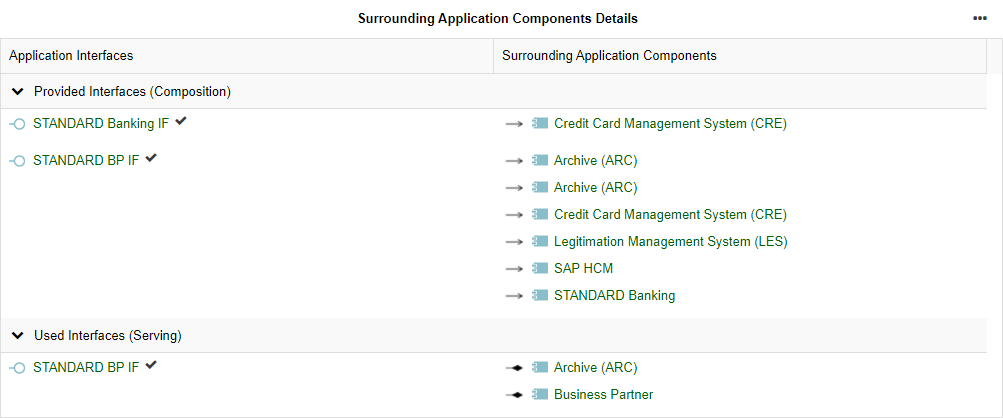
The following paths are evaluated:
Application Component
>Composed of>Application Interface>Serves>Application ComponentApplication Component
<Served by<Application Interface<Part of<Application Component
Application Component Score
This gauge chart shows the current value of the following attributes of the Application Component (one gauge for each attribute):
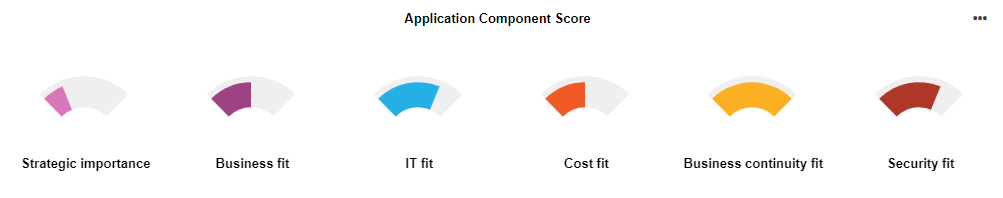
Strategic importance
Business fit
IT fit
Cost fit
Business continuity fit
Security fit
Redundancy Analysis
This table helps you detect redundant Application Components. It lists all other Application Components that realise the same Application Services or Capabilities. In addition, you can see whether there is need for action with regard to the listed Application Components.
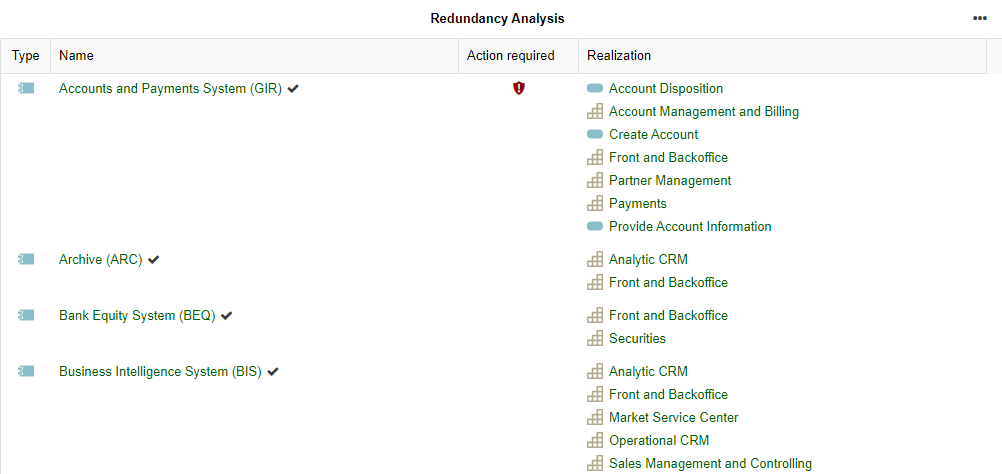
The following paths are evaluated:
Application Component
>Realizes>Application Service<Realized by<Application ComponentApplication Component
>Realizes>Capability<Realized by<Application Component
Lifecycle State & Investment Strategy
This widget shows the current value of the following attributes of the Application Component:

Lifecycle State
Investment strategy
Replaced by
For all Application Components which replace the current Application Component, this table lists the following attributes:

Investment Strategy
Valid From
Valid Until
Responsible business actors
Data Flow via Application Interfaces
This network diagram shows the information flow between Application Components.
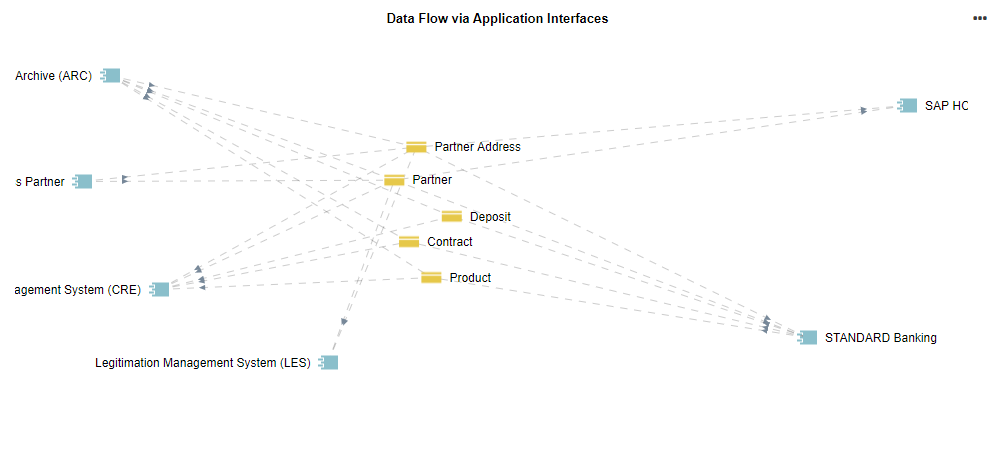
The following paths are evaluated:
Application Component
>Composed of>Application Interface>Accesses>Business Object or Data ObjectApplication Component
<Served by<Application Interface>Accesses>Business Object or Data Object
Business Objects, Data Objects and Application Components are represented as nodes. The arrow direction indicates whether the Application Component is using (incoming arrow) or providing (outgoing arrow) an Application Interface.
Example
The "Revenue Accounting System (RAC)" application uses an interface of the "Bank Equity System (BEQ)" application through which the data "Share" flows. That means: The "Share" data flows from the "Bank Equity System (BEQ)" application to the "Revenue Accounting System (RAC)" application.
The following options are available:
Drag a node to where you want it.
Click a node to only show directly connected objects.
Double-click a node to open the Notebook of the object.
Data Flow Overview
For all Business Objects or Data Objects which are associated with the Application Component through Application Interfaces, this table shows the current value of the following attributes:
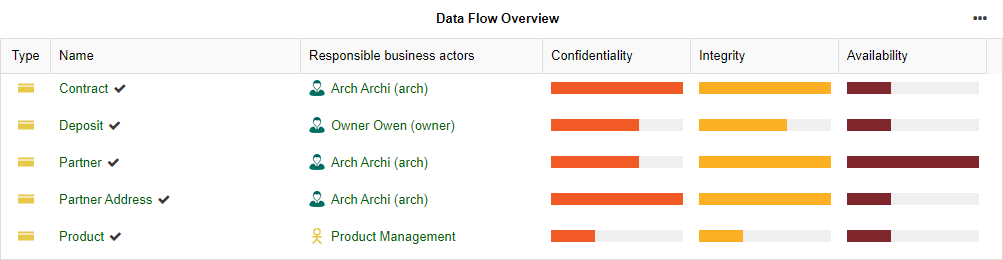
Responsible business actors
Confidentiality
Integrity
Availability
The following paths are evaluated:
Application Component
>Composed of>Application Interface>Accesses>Business Object or Data ObjectApplication Component
<Served by<Application Interface>Accesses>Business Object or Data Object
Technology Roadmap Status
The pie chart in this widget shows you at a glance the current roadmap status of the System Software elements used by this Application Component (attribute Standards lifecycle in the Notebook chapter "Lifecycle").

The following path is evaluated:
- Application Component
<Served by<System Software
By clicking a segment of the pie, you can highlight the corresponding System Software elements in the Serving System Software Elements list.
Serving System Software Elements
The table comprises all System Software elements which are used by the Application Component, and lists their attribute Standards lifecycle.
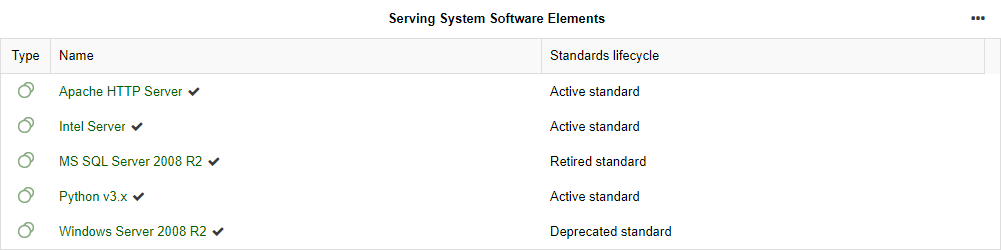
The following path is evaluated:
- Application Component
<Served by<System Software
Additional Widgets for Capabilities
The Insights Dashboard for Capabilities contains all default widgets and some additional widgets, which are described in detail below.
Capability Score
This gauge chart shows the current value of the following attributes of the Capability (one gauge for each attribute):
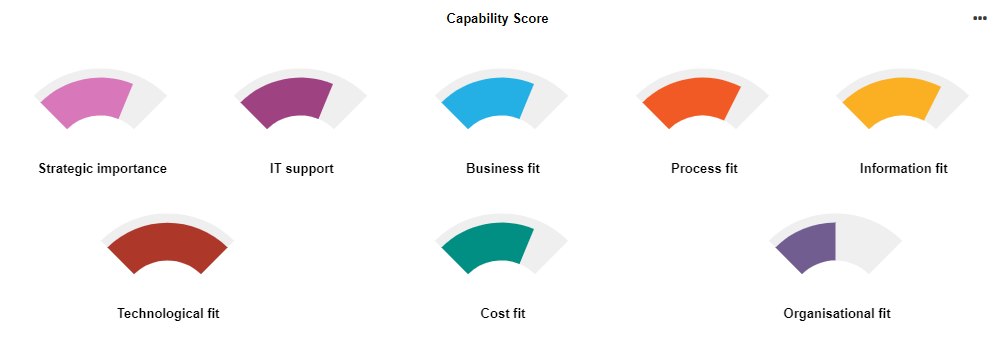
Strategic importance
IT support
Business fit
Process fit
Information fit
Technological fit
Cost fit
Organisational fit
Process Assessment
For all Business Processes which realise the Capability, this radar chart shows the current value of the following attributes:
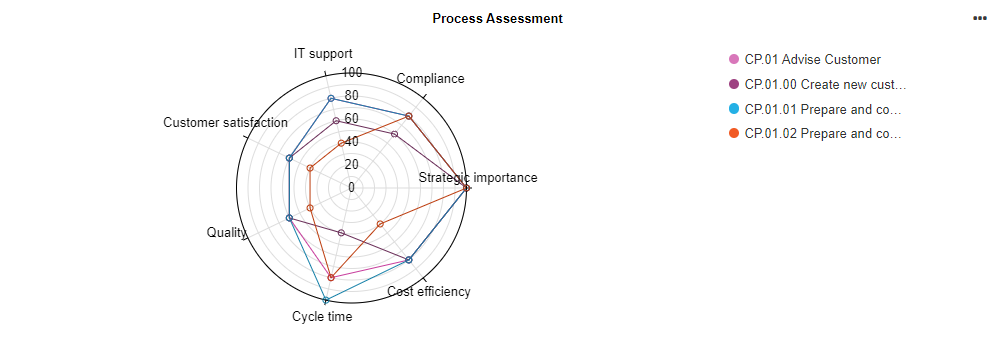
Strategic importance
Cost efficiency
Cycle time
Quality
Customer satisfaction
IT support
Compliance
The following path is evaluated:
- Capability
<Realized by<Business Process
Process Assessment Details
For all Business Processes which realise the Capability, this table lists the following attributes:
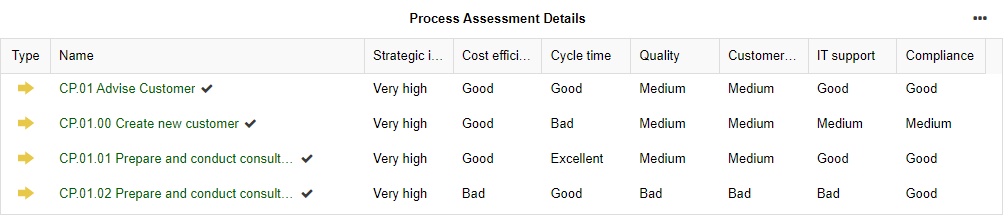
Strategic importance
Cost efficiency
Cycle time
Quality
Customer satisfaction
IT support
Compliance
The following path is evaluated:
- Capability
<Realized by<Business Process
Application Lifecycle State
The pie chart in this widget shows you at a glance the current Lifecycle state of the Application Components which realise the Capability.

The following path is evaluated:
- Capability
<Realized by<Application Component
By clicking a segment of the pie, you can highlight the corresponding Application Components in the Application Lifecycle State table.
Application Lifecycle Details
The table comprises all Application Components which realise the Capability, and lists their attribute Lifecycle state.

The following path is evaluated:
- Capability
<Realized by<Application Component
Application Fitness
For all Application Components which realise the Capability, this radar chart shows the current value of the following attributes:
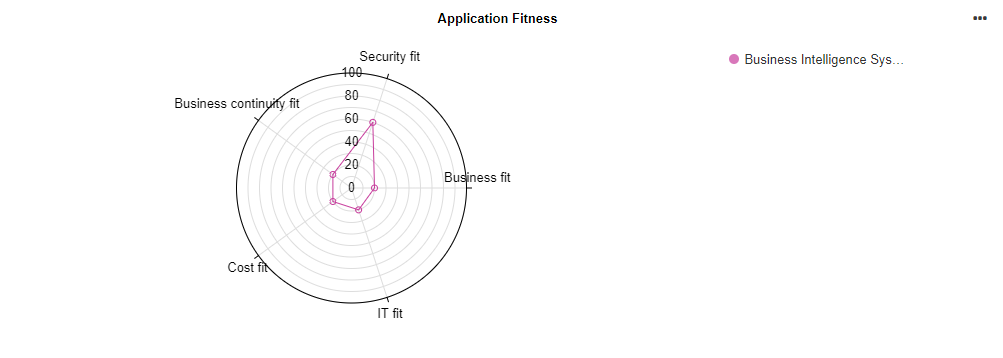
Business fit
IT fit
Cost fit
Business continuity fit
Security fit
The following path is evaluated:
- Capability
<Realized by<Application Component
Required Business Objects
This table lists all Business Objects which realise the Capability.

The following path is evaluated:
- Capability
<Realized by<Business Object
All in all, the following attributes are listed for each Business Object:
Responsible business actors
Confidentiality
Integrity
Availability
Budget
This bar chart displays the budgets of all Work Packages (projects) which realise the Business Capability.

The following path is evaluated:
- Capability
<Realized by<Work Package (attribute Specialisation = Project)
Work Packages
This table lists all Work Packages (projects) which realise the Capability.

The following path is evaluated:
- Capability
<Realized by<Work Package (attribute Specialisation = Project)
All in all, the following attributes are listed for each Work Package:
Specialisation
Risk
Priority
Budget
Additional Widgets for Business Objects
The Insights Dashboard for Business Objects contains all default widgets and some additional widgets, which are described in detail below.
Data Flow via Application Interfaces
This network diagram shows the information flow between Application Components.
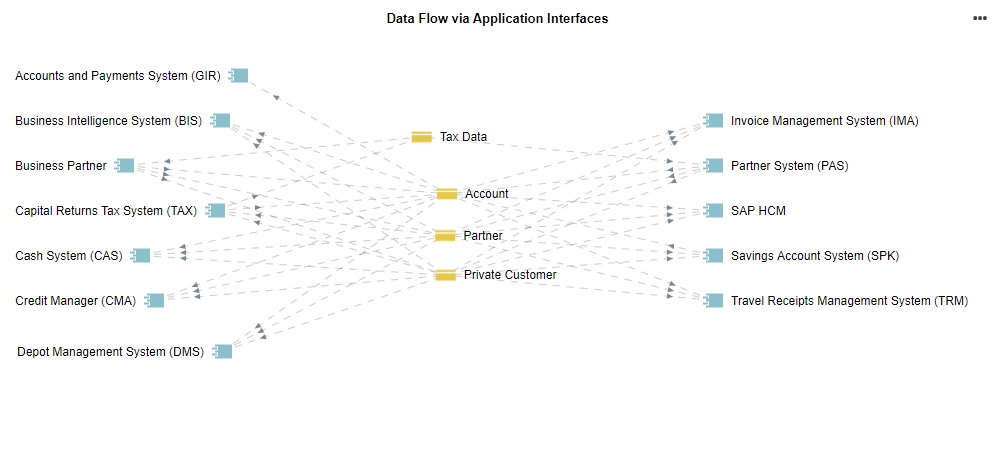
The following paths are evaluated:
Business Object
<Accessed by<Application Interface<Part of<Application ComponentBusiness Object
<Accessed by<Application Interface>Serves>Application Component
Business Objects and Application Components are represented as nodes. The Application Interfaces connecting the nodes are shown as branches. The arrow direction indicates whether the Application Component is using (incoming arrow) or providing (outgoing arrow) an Application Interface.
Example
The "Revenue Accounting System (RAC)" application uses an interface of the "Bank Equity System (BEQ)" application through which the data "Share" flows. That means: The "Share" data flows from the "Bank Equity System (BEQ)" application to the "Revenue Accounting System (RAC)" application.
The following options are available:
Drag a node to where you want it.
Click a node to only show directly connected objects.
Double-click a node to open the Notebook of the object.
Data Usage
For all Application Components which access the Business Object, this table shows whether they read, write or read & write the Business Object. The attribute Access type of the relation Access is evaluated for this purpose.
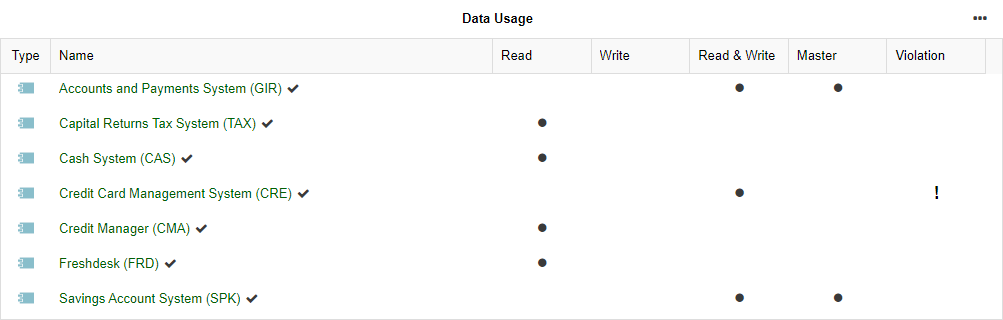
The following path is evaluated:
- Application Component
>Accesses>Business Object
In addition, you can see whether an Application Component is considered as Master of the Business Object. If the Application Component can write data without being the Master of the Business Object, an exclamation mark is displayed in the Violation column.
Security Requirements
This gauge chart shows the current value of the following attributes of the Business Object (one gauge for each attribute):

Confidentiality
Integrity
Availability
Score of Application Components
For all Application Components which access the Business Object, this radar chart shows the current value of the following attributes:
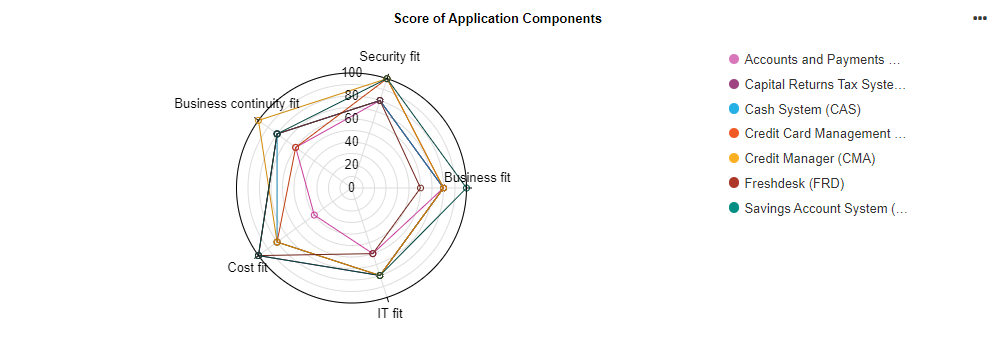
Business fit
IT fit
Cost fit
Business continuity fit
Security fit
The following path is evaluated:
- Application Component
>Accesses>Business Object
Application Components Details
For all Application Components which access the Business Object, this table lists the following attributes:
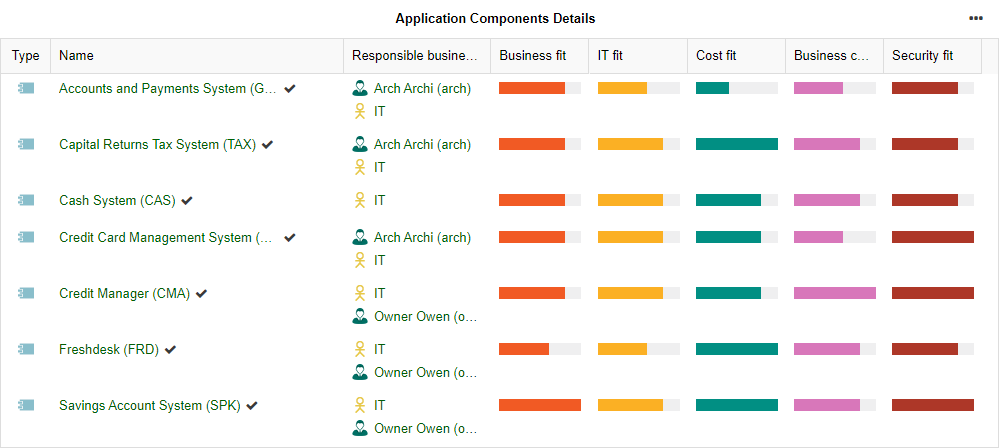
Responsible business actors
Business fit
IT fit
Cost fit
Business continuity fit
Security fit
The following path is evaluated:
- Application Component
>Accesses>Business Object
Additional Widgets for System Software Elements
The Insights Dashboard for System Software elements contains all default widgets and some additional widgets, which are described in detail below.
Technology Usage
This widget lists all other System Software elements that are used by the System Software currently being viewed.
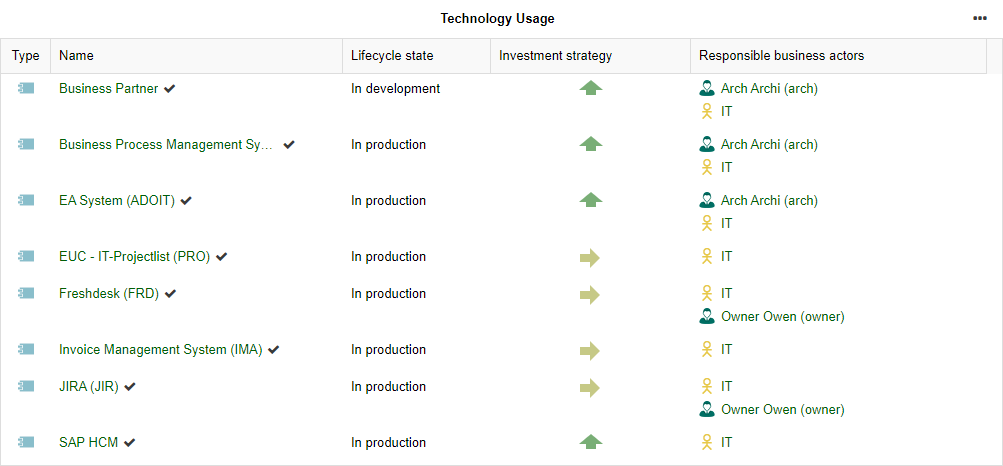
The following path is evaluated:
- System Software
>Realizes or Serves>System Software
All in all, the following attributes are listed for each System Software:
Lifecycle state
Investment strategy
Responsible business actors
Alternatives
This table helps you detect alternative System Software elements. It lists all other System Software elements in the same Category.
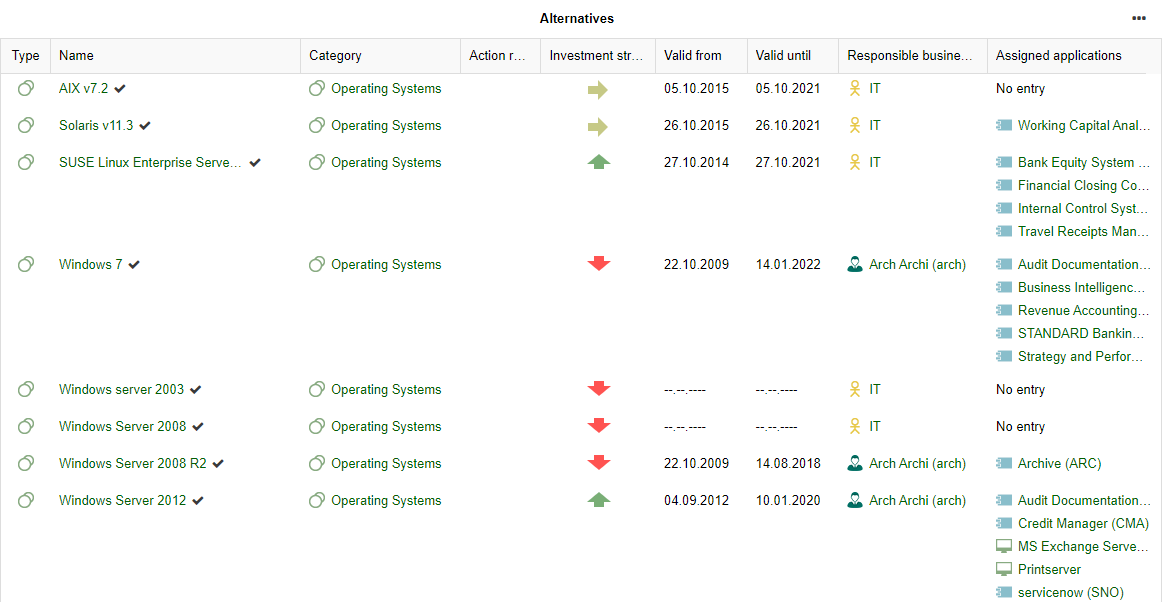
The following path is evaluated:
- System Software (= starting point)
>Specialized from>System Software (attribute Specialisation = Category)<Specialized by<System Software (= listed alternative technologies)
Example
"Oracle", "SQL Server" and "DB2" can be classified as tools in the "Databases" category.

If you look at the Insights dashboard of the "Oracle" System Software, "SQL Server" and "DB2" appear as alternative technologies.
All in all, the following attributes are listed for each System Software:
Category
Action required
Investment strategy
Valid from
Valid until
Responsible business actors
In the last column, you can see the Assigned applications for each alternative System Software element. The following path is evaluated:
- System Software (= listed alternative technologies)
>Serves>Application Component (= assigned applications)
Standards Lifecycle & Investment Strategy
This widget shows the current value of the following attributes of the System Software:

Standards lifecycle
Investment strategy
Replaced by
For all System Software elements which replace the current System Software, this table lists the following attributes:

Investment strategy
Valid from
Valid until
Responsible business actors
Additional Widgets for Plateaus
The Insights Dashboard for Plateaus contains all default widgets and some additional widgets, which are described in detail below.
Surrounding Plateaus
This widget shows surrounding Plateaus that trigger or are triggered by the Plateau currently being viewed.

The following paths are evaluated:
Plateau
>Triggers>PlateauPlateau
<Triggered by<Plateau
Each node represents a Plateau. The centre node is the Plateau you are interested in. The triggering Plateaus are placed to the left and the triggered Plateaus are placed to the right.
Related Architecture Elements
This table lists all Application Components, Application Interfaces, Application Services, Business Objects and Data Objects which are realised by the currently viewed Plateau. All listed related elements are grouped based on the values of the Specialization attribute of the Realizes relation.

Status and Confidence
This gauge chart shows the current value of the following attributes of the Plateau (one gauge for each attribute):

Status
Confidence
Outcome
This table lists all Outcomes which are realized by the currently viewed Plateau.

The following attributes are displayed for each listed Outcome:
Status
Confidence
Work Packages
This Gantt chart displays all Work Packages which realize the currently viewed Plateau.

You can see at a glance:
The date from which the Work Package becomes valid
The date until which the Work Package will be valid
Additional Widgets for Business Processes
The Insights Dashboard for Business Processes contains all default widgets and some additional widgets, which are described in detail below.
ADONIS Preview
This widget is only available if a Business Process was imported from ADONIS into ADOIT via the BOC Management Office Integration (MOI) interface. It shows the model that is referenced in the currently viewed Business Process on the ADONIS side.
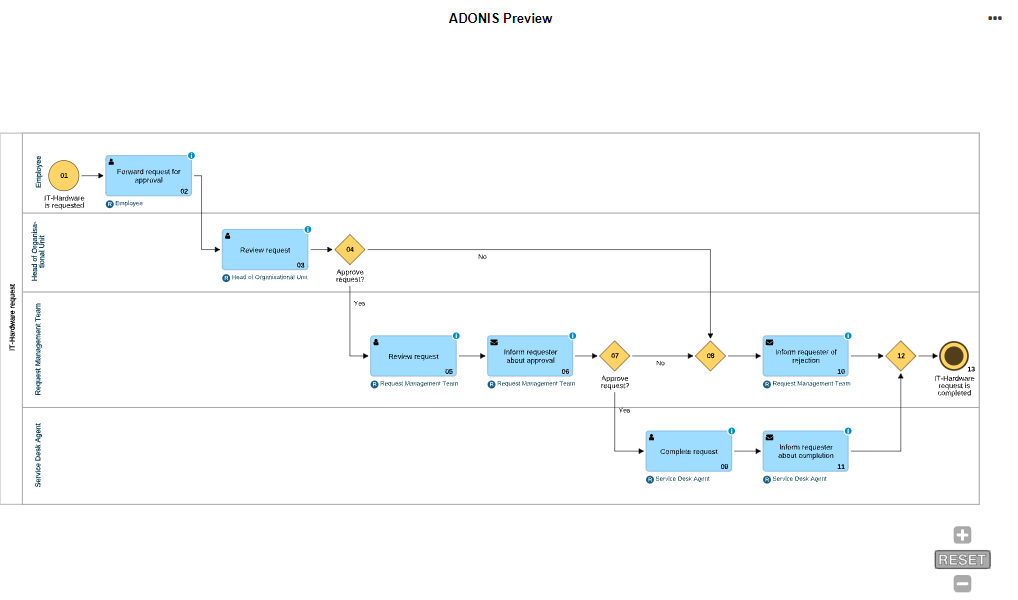
Open in ADONIS
To directly jump to the original model in ADONIS:
- Click the More button
 in the
top right corner of the widget, and then click
Open in ADONIS.
in the
top right corner of the widget, and then click
Open in ADONIS.
Process Potential and Maturity Analysis
This gauge chart helps to identify improvement potentials within the Business Process based on the results of an as-is analysis of various criteria. It shows the current value of the following attributes of the Business Process (one gauge for each attribute):
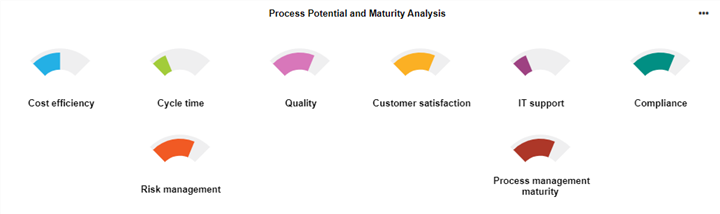
Cost efficiency
Cycle time
Quality
Customer satisfaction
IT support
Compliance
Risk management
Process management maturity