Application Scenarios when Using the Standard Library
This section describes the application scenarios for users of the ADOIT Standard Application Library.
Via the "Design & Document" scenario users will be able to design services and architectures and to plan initiatives.
The purpose of the "Control & Release" scenario is to let users review and release objects with a single click.
The purpose of the "Govern & Manage" scenario is to let users get the big picture of your enterprise.
The "Design & Document" Scenario
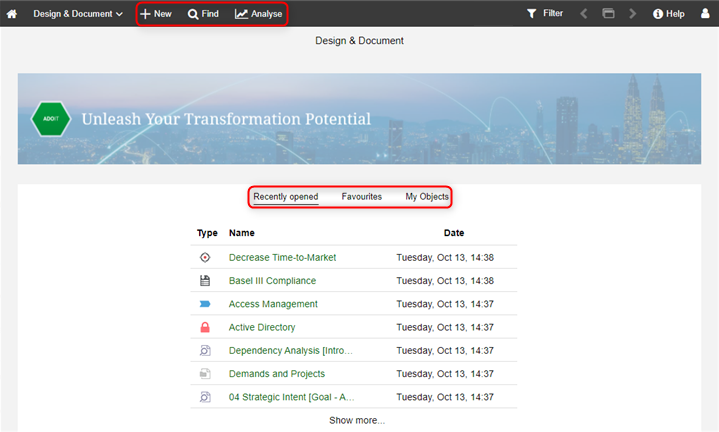
The purpose of the "Design & Document" scenario is to let you design your services and architectures and to plan your initiatives.
What you will see on the "Design & Document" start page
The start page has the following appearance:
Banner
The perfect place for an image that represents your organisation. Can be configured in the Administration Toolkit.
Recently opened
Your most recently opened models and objects. Sorted by date, with the most recent artefact placed at the top. To see additional artefacts, click Show more....
Favourites
Your favourite models and objects. Sorted alphabetically. To see additional artefacts, click Show more....
My Objects
A compact list of all repository objects for which you are responsible. Grouped by type and sorted alphabetically. To see additional objects, click Show more.... For a more detailed dashboard of your objects, go to Analyse
 > Dashboards > My
Objects.
> Dashboards > My
Objects.
Additional Options
The toolbar at the top of the screen provides access to some of the most used features in ADOIT:
New

Find

Open the Explorer and the search function in ADOIT. Multiple search and filtering options help you quickly find the artefact you are looking for.
Analyse
This page has two sections: Reports and Dashboards. Use the quick links at the top of the page to access these sections. The Reports section shows the Reporting Board, where PDF and RTF reports or graphical views can be created. The Dashboards section provides access to the My Objects, Applications, Master Planning, Risks, Technologies and Info & Tasks dashboards.
My Objects
This dashboard offers a detailed overview of your objects. You can confirm the data actuality of your objects, generate reports and open Insights dashboards. In addition, the following attributes are displayed for each object:
Lifecycle state
Action required
Responsibilities according to a RACI matrix
Filter Objects
By default, the My Objects dashboard displays all repository objects that are directly assigned to you. Alternatively, you can display all repository objects that are assigned to you via your Organisational Units.
In order to only display certain objects:
Click the widget title (button
 )
to open a drop-down menu.
)
to open a drop-down menu.Select either the menu entry Directly assigned or Assigned via my Organisational Units.
Directly assigned lists all repository objects:
- For which you are assigned as Responsible Person (object attribute in the Notebook chapter "Organisation")
Assigned via my Business Actors lists all repository objects:
- For which your Organisational Units are assigned as Responsible Organisational Unit (object attribute in the Notebook chapter "Organisation").
Applications
This area is divided into the widgets "Information and Warnings" and "All Applications/Services".
Information and Warnings
This widget provides a detailed overview of the alerts that ADOIT automatically generates for Applications and Services for which you are assigned as Responsible Person (object attribute in the Notebook chapter "Organisation"). You can see at a glance:
Which of your Applications use a Technology (object attribute Used Technologies in the Notebook chapter "Technologies") which is a Deprecated Standard or Obsolete Standard (object attribute Technology Roadmap Status in the Notebook chapter "Lifecycle").
Which of your Applications use an Interface (object attribute Used Interfaces in the Notebook chapter "Interfaces") with a Decommission Date within the next 12 months (object attribute in the Notebook chapter "Lifecycle").
Which of your Applications or Services have an insufficient Business Fit, IT Fit or Cost Fit (object attributes in the Notebook chapter "Classification").
Which of your Applications or Services support a Business Process with a low IT Support (object attribute in the Notebook chapter "Classification").
All Applications/Services
This widget provides a detailed overview of Applications and Services in the database. You can generate views and reports on the Applications and Services.
Filter Applications/Services (All/My)
You can switch between displaying all or my Applications and Services. For details, please refer to the section Filter Objects by Responsibility (All/My).
Master Planning
This area is divided into the widgets "Information and Warnings" and "Not Updated Objects".
Information and Warnings
This widget provides a detailed overview of the alerts that ADOIT automatically generates for Business Functions, Business Processes and Products for which you are assigned as Responsible Person (object attribute in the Notebook chapter "Organisation"). You can see at a glance:
- Which of your Business Functions, Business Processes and Products have a high or very high Strategic Importance and a low IT Support (object attributes in the Notebook chapter "Classification").
Not Updated Objects
This widget provides a detailed overview of architecture artefacts (= objects) in the database whose data actuality is not confirmed.
Filter Objects (All/My)
You can switch between displaying all or my objects. For details, please refer to the section Filter Objects by Responsibility (All/My).
Risks
This widget provides an overview of your assets with Assigned Risks (object attribute in the Notebook chapter "Risks" or "Risk Assessment"). You can generate views and reports on the assets.
Filter Assets (All/My)
You can switch between displaying all or my assets. For details, please refer to the section Filter Objects by Responsibility (All/My).
Technologies
This area is divided into the widgets "Information and Warnings" and "All Technologies/Technology Packages".
Information and Warnings
This widget provides a detailed overview of the alerts that ADOIT automatically generates for Technologies for which you are assigned as Responsible Person (object attribute in the Notebook chapter "Organisation"). You can see at a glance:
Which of your Technologies are a Deprecated Standard or Obsolete Standard (object attribute Technology Roadmap Status in the Notebook chapter "Lifecycle"), and are assigned to Technology Packages (object attribute Assigned Technologies in the Notebook chapter "Technologies").
Which of your Technologies are an Obsolete Standard (object attribute Technology Roadmap Status in the Notebook chapter "Lifecycle"), and are assigned to Applications (object attribute Assigned Technologies in the Notebook chapter "Technologies").
All Technologies/Technology Packages
This widget provides a detailed overview of Technologies and Technology Packages in the database. You can generate views and reports on the Technologies and Technology Packages.
Filter Technologies/Technology Packages (All/My)
You can switch between displaying all or my Technologies and Technology Packages. For details, please refer to the section Filter Objects by Responsibility (All/My).
Info & Tasks
This area lists ADOIT-specific news. Furthermore, it provides a detailed overview of the most recent changes in models and objects in the database and your tasks. This information is also available from the scenario start page, but presented here in a much more detailed form.
Task Options
In order to access the task options:
- Click the widget title (button )
to open a drop-down menu.
The drop-down menu offers the following options:
Create new task
Mark selected task(s) as read
Mark selected task(s) as unread
Hide or show done tasks
Mark selected task(s) as done
Mark selected task(s) as undone
Delete selected task(s)
What are Assets?
The following object types are referred to as "assets" when using the ADOIT Standard Application Library: Application, Application Component, Business Capability, Business Object, Business Process, Database, Infrastructure Element, Interface, IT Asset, IT Service, Location, Network Element, Organisational Unit, Product, Project, Service, Technology and Technology Package.
The "Control & Release" Scenario
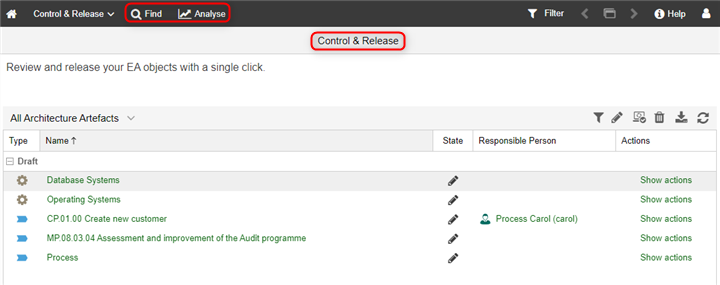
The purpose of the "Control & Release" scenario is to let you review and release objects with a single click.
What you will see on the "Control & Release" start page
The start page has the following appearance:
"Control & Release" Dashboard
Review and release objects. The Control & Release dashboard will show you all repository objects with transitions that you can execute.
Additional Options
The toolbar at the top of the screen provides access to some of the most used features in ADOIT:
Find
Open the Explorer and the search function in ADOIT. Multiple search and filtering options help you quickly find the artefact you are looking for.
Analyse
This page has two sections: Reports and Dashboards. Use the quick links at the top of the page to access these sections. The Reports section shows the Reporting Board, where PDF and RTF reports or graphical views can be created. The Dashboards section provides access to the My Objects and Info & Tasks dashboards.
"Control & Release" Dashboard
This area lists all repository objects for which you can execute a transition. The objects are grouped by status and sorted alphabetically.
Object Release
You can release objects quickly. In order to execute a transition:
In the Actions column, click the Show actions link to display all available transitions.
Click the appropriate icon.
Filter Architecture Artefacts (All/My)
You can switch between displaying All or My architecture artefacts (= objects). For details, please refer to the section Filter Objects by Responsibility (All/My).
Filter Architecture Artefacts by Object Type
In order to only display objects of a certain type:
Click the Object type filter button
 .
.Select the object types which should be visible in ADOIT.
Click Apply.
Filter Architecture Artefacts by State
In order to filter architecture artefacts by state:
- Click the icons
 ,
,
 or
or
 .
.
You can show or hide objects in the state " Draft", " Under review" or " To be deleted".
My Objects
This area is identical in both the "Design & Document" and "Control & Release" scenarios. Therefore, please refer to the corresponding description here.
Info & Tasks
This area is identical in both the "Design & Document" and "Control & Release" scenarios. Therefore, please refer to the corresponding description here.
The "Govern & Manage" Scenario
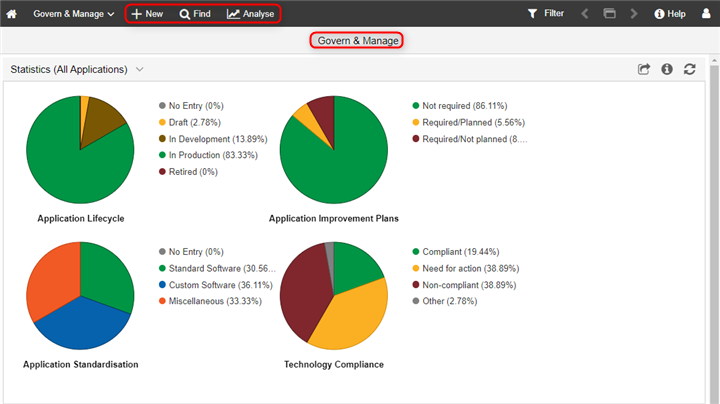
The purpose of the "Govern & Manage" scenario is to let you get the big picture of your enterprise.
What you will see on the "Govern & Manage" start page
The start page has the following appearance:
"Govern & Manage" Dashboard
The pie charts and spider diagrams in the Govern & Manage dashboard visualise the status of architecture artefacts such as Applications, Business Capabilities, Technologies and related Risks.
Additional Options
The toolbar at the top of the screen provides access to some of the most used features in ADOIT:
New
Find
Open the Explorer and the search function in ADOIT. Multiple search and filtering options help you quickly find the artefact you are looking for.
Analyse
This page has two sections: Reports and Dashboards. Use the quick links at the top of the page to access these sections. The Reports section shows the Reporting Board, where PDF and RTF reports or graphical views can be created. The Dashboards section provides access to the My Objects, Applications, Master Planning, Risks, Technologies and Info & Tasks dashboards.
"Govern & Manage" Dashboard
This area is divided into the widgets "Statistics (All Applications)", "Change Budget (All Business Capabilities)", "Statistics (All Business Capabilities)", "Business Capability Assessment (All Business Capabilities)", Assets at risk (My Assets) and "Technology Roadmap Status (All Technologies)".
Statistics (All Applications)
The calculation basis for the pie charts in this widget are either all or my Applications:
Filter Applications (All/My)
You can switch between displaying all or my Applications. For details, please refer to the section Filter Objects by Responsibility (All/My).
Application Lifecycle
This pie chart provides you with an overview of the lifecycle state of Applications in your organisation.
Application Improvement Plans
This pie chart provides you with the following information about Applications:
Not required: Which applications do not require any improvement?
Required/Planned: For which applications are improvement activities required and planned to be carried out during projects?
Required/Not planned: For which applications are improvement activities required, but not yet planned to be carried out during projects?
Application Standardisation
This pie chart categorizes Applications according to the types: Standard Software, Custom Software or Miscellaneous (attribute Category in the Notebook chapter "Classification").
Technology Compliance
This pie chart shows for Applications whether they are compliant, non-compliant or being considered for improvement activities to make them compliant to the underlying technology:
Standard and active technologies ( Compliant) or:
Technologies that are going out of support soon ( Need for action) or:
Obsolete technologies ( Non-compliant)
Change Budget (All Business Capabilities)
This bar chart illustrates the authorised and required budget for Business Capabilities. The green bars represent the authorised budget and the red bars represent the required budget. Only Business Capabilities with an Assigned Domain are considered (object attribute in the Notebook chapter "Domains").
Filter Business Capabilities (All/My)
You can switch between displaying all or my Business Capabilities. The Business Capabilities are determined by the responsibility for the assigned Domains. For details, please refer to the section Filter Objects by Responsibility (All/My).
Statistics (All Business Capabilities)
The calculation basis for the pie charts in this widget are either all or my Business Capabilities. Only Business Capabilities with an Assigned Domain are considered (object attribute in the Notebook chapter "Domains").
Filter Business Capabilities (All/My)
You can switch between displaying all or my Business Capabilities. The Business Capabilities are determined by the responsibility for the assigned Domains. For details, please refer to the section Filter Objects by Responsibility (All/My).
Business Fit
This pie chart shows the outcome of the assessment of the Business Fit of Business Capabilities (attribute in the Notebook chapter "Classification"). The assessment is based on:
Functional coverage: Customer assessment to identify whether the desired functionalities have been provided in good quality and appropriate scale.
Number of SLA breaches in the latest period under consideration.
Process Fit
This pie chart shows the outcome of the assessment of the Process Fit of Business Capabilities (attribute in the Notebook chapter "Classification"). The business processes related to your Business Capabilities will be scored based on processing times, duration times, process harmonisation grades, and error rates.
Information Fit
This pie chart shows the outcome of the assessment of the Information Fit of Business Capabilities (attribute in the Notebook chapter "Classification"). Business Capabilities are assessed in regard to the availability of required information. Typically, the capabilities are ranked on a scale such as:
Needed information is not available.
Needed information is available but difficult to gather.
Information is readily available and easily accessible.
Technological Fit
This pie chart shows the outcome of the assessment of the Technological Fit of Business Capabilities (attribute in the Notebook chapter "Classification"). The assessment explores from a technical point of view, to what extent the requirements of the Business Capabilities are met by the supporting Applications and Technologies.
Cost Fit
This pie chart shows the outcome of the assessment of the Cost Fit of Business Capabilities (attribute in the Notebook chapter "Classification"). The assessment explores if investment and operating costs are incurred reasonably.
Business Capability Assessment (All Business Capabilities)
Business Capabilities can be scored based on their Business Fit, Process Fit, Information Fit, Technological Fit and Cost Fit. This spider diagram shows the outcome of the assessment of Business Capabilities according to all of these criteria. Only Business Capabilities with an Assigned Domain are considered (object attribute in the Notebook chapter "Domains").
Filter Business Capabilities (All/My)
You can switch between displaying all or my Business Capabilities. The Business Capabilities are determined by the responsibility for the assigned Domains. For details, please refer to the section Filter Objects by Responsibility (All/My).
Assets at risk (My Assets)
In this pie chart, your assets are scored according to three risk categories. For each of your assets, the chart considers the highest risk priority or in other words highest threat. Assets that are scored from 0 to 500 are considered to have a low risk priority, and therefore no action is necessary. Assets that are scored from 501 to 750 are at risk and need to be monitored. For assets that are scored over 751, risk-mitigating measures are mandatory. Only objects with Assigned Risks are considered (object attribute in the Notebook chapter "Risks" or "Risk Assessment").
Risk appetite and the related thresholds of risk priorities can be defined individually.
Filter Assets (All/My)
You can switch between displaying all or my assets. For details, please refer to the section Filter Objects by Responsibility (All/My).
Technology Roadmap Status (All Technologies)
This pie chart provides an overview of the number and percentage of Technologies that are categorised either as a Trial Standard, Active Standard, Deprecated Standard or Obsolete Standard (object attribute Technology Roadmap Status in the Notebook chapter "Lifecycle").
Filter Technologies (All/My)
You can switch between displaying all or my Technologies. For details, please refer to the section Filter Objects by Responsibility (All/My).
My Objects
This area is identical in both the "Design & Document" and "Govern & Manage" scenarios. Therefore, please refer to the corresponding description here.
Applications
This area is divided into the widgets "Statistics (All Applications)" and "All Applications".
Statistics (All Applications)
This widget is also displayed on the scenario start page. Therefore, please refer to the corresponding description here.
All Applications
This widget provides a detailed overview of Applications in the database. You can see at a glance to what extent there is need for action in regard to the listed Applications (object attribute Action Required in the Notebook chapter "General information").
Filter Applications (All/My)
You can switch between displaying all or my Applications. For details, please refer to the section Filter Objects by Responsibility (All/My).
Master Planning
This area is divided into the widgets "Statistics (All Business Capabilities)", "Business Capability Assessment (All Business Capabilities)", "All Business Capabilities" and "Change Budget (All Business Capabilities)".
Statistics (All Business Capabilities)
This widget is also displayed on the scenario start page. Therefore, please refer to the corresponding description here.
Business Capability Assessment (All Business Capabilities)
This widget is also displayed on the scenario start page. Therefore, please refer to the corresponding description here.
All Business Capabilities
This widget provides a quick overview of Business Capabilities with an Assigned Domain (object attribute in the Notebook chapter "Domains"). You can see at a glance the fitness of the Business Capabilities listed here according to different criteria.
Filter Business Capabilities (All/My)
You can switch between displaying all or my Business Capabilities. The Business Capabilities are determined by the responsibility for the assigned Domains. For details, please refer to the section Filter Objects by Responsibility (All/My).
Change Budget (All Business Capabilities)
This widget is also displayed on the scenario start page. Therefore, please refer to the corresponding description here.
Risks
This area is divided into the widgets "My Assets", "Assets at risk (My assets)" and "Highest Total Value of Risk (My Assets)".
My Assets
This widget provides a quick overview of your assets. Only objects with Assigned Risks are considered (object attribute in the Notebook chapter "Risks" or "Risk Assessment").
For each asset, the assigned Risk with the highest threat value is displayed. The threat value is calculated automatically based on the Probability, Impact and Detection values of a Risk (attributes in the Notebook of the reference Assigned Risks, chapter "Risk Assessment").
Filter Assets (All/My)
You can switch between displaying all or my assets. For details, please refer to the section Filter Objects by Responsibility (All/My).
Assets at risk (My assets)
The "Assets at risk (My assets)" widget is also displayed on the scenario start page. Therefore, please refer to the corresponding description here.
Highest Total Value of Risk (My Assets)
This chart shows the outcome of the risk assessment of your assets. By moving your mouse over the chart, you can display the highest total risk score among all the assets. Only objects with Assigned Risks are considered (object attribute in the Notebook chapter "Risks" or "Risk Assessment").
Filter Assets (All/My)
You can switch between displaying all or my assets. For details, please refer to the section Filter Objects by Responsibility (All/My).
Technologies
This area is divided into the widgets "All Technologies/Technology Packages", "Technology Roadmap Status (All Technologies)" and "Technology Usage Statistics (All Technologies)".
All Technologies/Technology Packages
This widget provides a quick overview of Technologies and Technology Packages in the database. You can generate views and reports on your Technologies and Technology Packages and find out quickly about the data actuality of these objects.
Filter Technologies/Technology Packages (All/My)
You can switch between displaying all or my Technologies and Technology Packages. For details, please refer to the section Filter Objects by Responsibility (All/My).
Technology Roadmap Status (All Technologies)
This widget is also displayed on the scenario start page. Therefore, please refer to the corresponding description here.
Technology Usage Statistics (All Technologies)
This bar chart provides you with an overview of the number of Applications that use Technologies and Technology Packages. Each bar represents one of the Technologies and Technology Packages.
Filter Technologies/Technology Packages (All/My)
You can switch between displaying all or my Technologies and Technology Packages. For details, please refer to the section Filter Objects by Responsibility (All/My).
Info and Tasks
This area is identical in both the "Design & Document" and "Govern & Manage" scenarios. Therefore, please refer to the corresponding description here.