Insights Dashboards
An Insights dashboard displays essential information about a specific model or object in your organisation, and has a quick access area for key features.
Insights Dashboard vs. Notebook
An Insights dashboard summarizes the most important information about a model or object, such as aggregated data, information about referenced objects with charts etc. This information is presented in an easily understandable and visually appealing way. The Notebook, on the other hand, is a dedicated tool for editing and reading master data and contains no graphics. The Notebook is for data management, while an Insights dashboard is for reading and analysis.
Availability of Insights Dashboards
The availability of Insights dashboards depends on the application library. In the ADONIS BPMS Application Library, the following Insights dashboards are available:
Insights Dashboard for Business Process Diagrams
Provides insights into Business Process Diagrams.
Provides insights into Roles.
Insights Dashboard for Organisational Units
Provides insights into Organisational Units.
Open Insights Dashboard
To open an Insights dashboard:
- Right-click the model or object, point to Open, and then click Insights
 .
.
You can open an Insights dashboard this way using e.g. the Explorer or a dashboard as a starting
point. Additionally, it is possible to open an Insights dashboard directly from the graphical editor
by clicking the Insights button ![]() .
.
Show/Hide Empty Sections
By default, all areas of an Insights dashboard for which no data is available are hidden. To show or hide empty sections:
- Click the Show empty sections button
 at the top of the Insights
dashboard.
at the top of the Insights
dashboard.
Available Functions
Across all widgets (= small program windows) of the various Insights dashboards various functions
are available. Click the More button
![]() to access these functions:
to access these functions:
Show a tooltip with information about the widget (icon
 )
)Export the content of a widget as a PDF file or Excel file (XLSX format) (icon
 )
)Refresh a widget to get the latest data (icon
 )
)Filter data in columns to show the elements you want and hide the rest:
Show or hide filters (icon
 )
)Clear all filters (icon
 )
)
Show or hide columns (icon
 )
)
Insights Dashboard for Business Process Diagrams
This dashboard consists of the following areas:
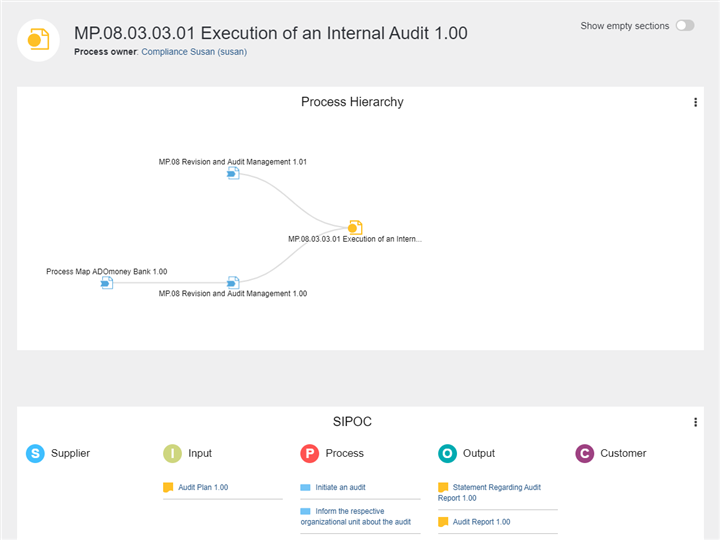
Process Hierarchy
This widget shows the parent processes as well as the child processes of the Business Process Diagram in the process hierarchy of the organisation (to better understand the context of the process currently being viewed).
Each node represents a process. The centre node is the Business Process Diagram you are interested in. The incoming and outgoing relations are shown as branches, with the incoming paths to the left and the outgoing paths to the right.
The following options are available:
Click a node to collapse or expand a branch.
Click a node title to open the model.
SIPOC
The SIPOC widget enables you to analyse the process with a SIPOC table. The acronym SIPOC stands for:
Supplier
The provider of inputs into a process.
Input
Materials, information and other resources needed to complete a process.
Process
Tasks used to convert inputs into outputs.
Output
Products or services resulting from the process.
Customer
Recipient of the outputs.
These 5 key elements form the columns of the table, where the focus is on summarizing the inputs and outputs.
What Data Is Displayed in the Columns?
Supplier: All External Partners, Organisational Units und Roles listed as Process suppliers for the Business Process Diagram.
Input: All Documents listed as Input for the Business Process Diagram or as Data input for the objects in the model.
Process: All Tasks contained in the Business Process Diagram.
Output: All Documents listed as Output for the Business Process Diagram or as Data output for the objects in the model.
Customer: All External Partners, Organisational Units und Roles listed as Process customers for the Business Process Diagram.
Note that suppliers and customers can be internal or external to the organization performing the process.
A SIPOC has its origins in TQM initiative and is still widely used today in Six Sigma, lean manufacturing and more general in business process management.
RACI and Input/Output Insights
Involved Roles (RACI)
This table lists all Roles relevant for the process and their degree of responsibility and involvement.
Inputs, Outputs and Applicable Documents
This table lists all Documents relevant for the process and whether they are classified as Input, Output or as Referenced documents. Additionally, the Document owner and Document type are shown. To view or download a document, click the icon in the File column.
IT and Resource Insights
IT Systems and Resources
This table comprises all Applications, Services, Infrastructure Elements and Resources needed for running this process, and lists their attributes Responsible person and Application type or Resource type.
Process Assessment Insights
Process Potential and Maturity Analysis
This gauge chart shows the current value of the following attributes of the Business Process Diagram (one gauge for each attribute):
Cost efficiency
Cycle time
Quality
Customer satisfaction
IT support
Compliance
Risk management
Process management maturity
Move the mouse pointer over a gauge to display a tooltip with the exact percentage.
Risk Insights
Risk and Control Overview
This table provides a compact overview of all relevant Risks as well as the assigned Controls mitigating the Risks. All in all, the following attributes are listed for each Risk:
Likelihood
Impact
Detection
Value at risk
Responsible person
Required controls
Performance Insights
Key Performance Indicators
This table shows the current value of the following attributes of all Performance Indicators contained in the Business Process Diagram:
State
Current value
Target value
Unit
Periodicity
Initiative Insights
Initiatives
For all Initiatives assigned to this process, this table shows the current value of the following attributes:
State
Progress (automatic)
Responsible person
Quick Access
The quick access area allows you to further explore details you are interested in. You can perform the following actions:
RACI Matrix
Analyse and visualise project roles and responsibilities.
QM report
Create a QM report containing information about responsibilities, scope, inputs, outputs, resources and the flow of the business process.
Standard report
Create a report with all important information about the business process.
References
Show references of the business process.
Validation
Verify compliance with various guidelines and best practices.
Simulation
Simulate the execution of your business process to find out about cycle times, costs and resources.
Insights Dashboard for Roles
This dashboard consists of the following areas:
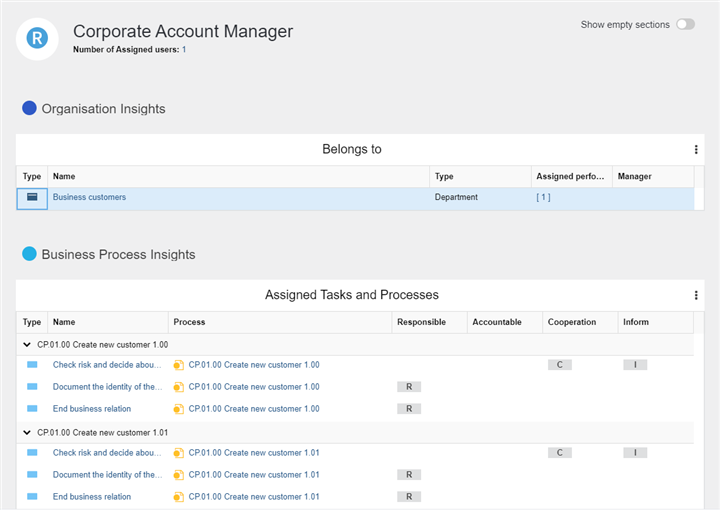
Organisation Insights
Belongs to
For all Organisational Units to which the Role belongs, this table provides the following information:
the Type of the Organisational Unit
the number of Assigned performers/users
the content of the Manager attribute
a list of all Assigned Business Process Diagrams
Business Process Insights
Assigned Tasks and Processes
For all Tasks assigned to the Role, this table provides the following information:
the model in which the Task is maintained
the responsibilities of the Role for each Task according to a RACI matrix
Business Process Classification (Overview)
This table lists all Business Process Diagrams which contain Tasks the Role is responsible for. The following paths are evaluated:
- Role
<any RACI relation (Responsible, Accountable, Consulted or Informed)<Task<Business Process Diagram
All in all, the following attributes are listed for each Business Process Diagram:
State
Process Owner
Key process
Process type
Predictability
Complexity
Process frequency
Business value
Business Process Classification (Charts)
This widget helps classify the Business Process Diagrams which contain Tasks the Role is responsible for. The following paths are evaluated:
- Role
<any RACI relation (Responsible, Accountable, Consulted or Informed)<Task<Business Process Diagram
The pie charts show the distribution of a set of given values for the following attributes:
Key process
Process type
Predictability
Complexity
Process frequency
Business value
Business Process Scoring
This radar chart helps to analyse improvement potential in Business Process Diagrams based on a simple as-is assessment of the attributes Quality, Cycle time, Cost efficiency, Customer satisfaction, IT support, Compliance and Risk management.
The following paths are evaluated:
- Role
<any RACI relation (Responsible, Accountable, Consulted or Informed)<Task<Business Process Diagram
BPMS Responsibilities
Asset Responsibilities
This table lists all repository objects the Role is responsible for.
Model Responsibilities
For all models assigned to the Role, this table provides the following information:
the State of the model
the responsibilities of the Role for each model according to an OMRA matrix (Process owner, Process manager, Methodical reviewer or Process analyst/designer)
the validity period of the model
Initiative Insights
Related Initiatives
For all Initiatives assigned to this Role, this table shows the current value of the following attributes:
State
Progress (automatic)
Responsible person
Quick Access
The quick access area allows you to further explore details you are interested in. You can perform the following actions:
RACI Matrix
Analyse and visualise project roles and responsibilities.
Object report
Create a report with all important information about the Role.
References
Show references of the Role.
Validation
Verify compliance with various guidelines and best practices.
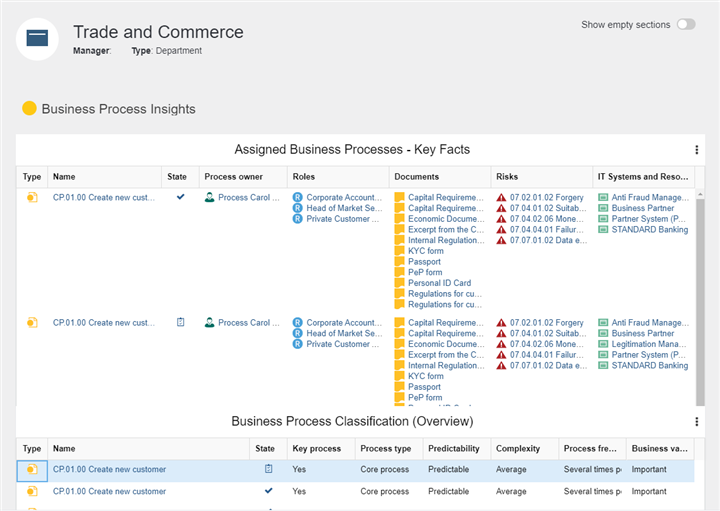
Insights Dashboard for Organisational Units
This dashboard consists of the following areas:
Business Insights
Assigned Roles
For all Roles assigned to the Organisational Unit, this table provides the following information:
the number of Assigned users
the Business Process Diagrams each Role is responsible for according to a RACI matrix
Work Instructions, Templates and Further Documents
This table lists all Documents which are referenced by the Organisational Unit. The Document owner and Document type are shown. To view or download a document, click the icon in the File column.
Business Process Insights
Assigned Business Processes - Key Facts
For all Business Process Diagrams assigned to the Organisational Unit, this table provides the following information:
the State of the model
the Process owner of the model
all Roles which are responsible for Tasks in the process according to a RACI matrix
all Documents which are relevant for the process as Input, Output or as Referenced documents
all Risks that affect Tasks in the process, or the process itself
all Applications, Services, Infrastructure Elements and Resources which are assigned to Tasks in the process, or to the process itself
Business Process Classification (Overview)
For all Business Process Diagrams assigned to the Organisational Unit, this table lists the following attributes:
State
Key process
Process type
Predictability
Complexity
Process frequency
Business value
Business Process Classification (Charts)
This widget helps classify the Business Process Diagrams assigned to the Organisational Unit. The pie charts show the distribution of a set of given values for the following attributes:
Key process
Process type
Predictability
Complexity
Process frequency
Business value
Business Process Scoring
This radar chart helps to analyse improvement potential in Business Process Diagrams assigned to the Organisational Unit based on a simple as-is assessment of the following attributes:
Cost efficiency
Cycle time
Quality
Customer satisfaction
IT support
Compliance
Risk management
Initiative Insights
Related Initiatives
For all Initiatives assigned to this Organisational Unit, this table shows the current value of the following attributes:
State
Progress (automatic)
Responsible person
Risk Insights
Assigned Risks
This table provides a compact overview of all relevant Risks as well as the assigned Controls mitigating the Risks. All in all, the following attributes are listed for each Risk:
Likelihood
Impact
Detection
Value at risk
Responsible person
Required controls
Quick Access
The quick access area allows you to further explore details you are interested in. You can perform the following actions:
Matrix
Show which Performers/Users have a Role that is assigned to the Organisational Unit.
Object report
Create a report with all important information about the Organisational Unit.
References
Show references of the Organisational Unit.
Validation
Verify compliance with various guidelines and best practices.