Model Comparison
The graphical comparison of models makes the differences between two models visible. This includes deleted objects and connectors, new objects and connectors as well as changes in the attribute values. Thereby it is possible to highlight the differences in e.g. two versions of one process. If you have sufficient user rights, you can also edit the models.
In addition, all differences are listed in detail in a table. This table can be exported as an Excel file (XLSX format).
The attributes which should be considered when comparing models can be configured in the Administration Toolkit.
Start Comparison
In order to compare models:
Select the first model in the Explorer. This model represents the state of the model before changes. On the UI it is called the base model.
Press <Ctrl> and select the second model in the Explorer. This model represents the state of the model after changes.
Right-click the selected models, and then click Compare. The model comparison opens.
Comparison with Predecessor Model
Additionally, you can directly compare a versioned model with its predecessor model:
Open the model in the graphical editor.
Click the Release button
in the menu bar of the model, and then click Show changes.
The model comparison opens. The predecessor model is assigned as the base model.
If you do not have access to the predecessor model, the predecessor model is not visualized. The result of the model comparison is only shown in tabular form.
To compare the predecessor model with the pre-predecessor model etc., again click Release and then Show changes.
Results of the Model Comparison
The result of the comparison is displayed as follows:

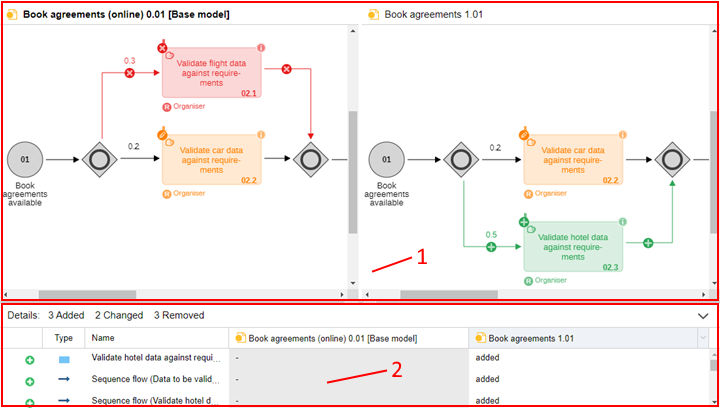
The two models are opened in side by side model windows in the graphical editor (1). Differences between the models are highlighted. The base model is always on the left side.
The results of the model comparison are simultaneously displayed in a table (2).
Graphical Model Comparison (1)
Differences between the models are highlighted as follows:
Grey
The object or connector is identical in both models.
Red (icon
)
The object or connector only occurs in the left model (the base model). It was removed from the newer model on the right.
Green (icon
)
The object or connector only occurs in the right model. It was added to the newer model on the right.
Orange (icon
)
The object or connector has different attribute values in the two models. Hover the mouse pointer over the element to display a tooltip with information about the changes.
Tabular Model Comparison (2)
The results of the model comparison are displayed as follows in the table:
The table header contains a summary of the changes.
Objects and connectors are presented as table rows, while the table columns list the differences.
Removed (icon
), added (icon
) and changed (icon
) objects or connectors are shown.
Switch Base Model
In order to switch the base model:
- Click the Switch base model icon
in the menu bar.
Switch Active Model
The menu bar is shared between both model windows. Some of the functions which can be accessed through the menu bar are specific to the active model.
The active model is the model which is currently being edited. It can be identified by its title which is displayed in bold. In order to switch the active model:
- Click anywhere on the drawing area in the inactive model.
Refresh Results
When you edit one of the models, the Refresh icon and the title of the model comparison become red. This indicates that the current view is outdated. In order to refresh the view:
- Click the Refresh icon
in the menu bar.
Navigate through Results
There are different options to navigate through the results:
Synchronized Scrolling and Zooming
Scrolling and zooming is synchronized between the two model windows:
- When scrolling through the content of one of the models or changing the zoom factor, the corresponding change is mirrored in the other model.
Connection between the comparison table and the model windows
The comparison table and the model windows are connected as follows:
- When you click a cell, the according object or connector is displayed centred and marked red in the model window.
Open Notebook from Comparison Table
In order to open the Notebook of an Object or Connector in the comparison table:
- Double-click a cell to open the notebook of the corresponding object or connector.
Export Results
In order to export the comparison results as an Excel file (XLSX format):
- Click the Share button
in the menu bar, and then click Export as Excel.
In the Excel spreadsheet, removed, added and changed objects or connectors are shown.