Insights Dashboards
An Insights dashboard displays essential information about a specific model or object in your organisation, and has a quick access area for key features.
Insights Dashboard vs. Notebook
An Insights dashboard summarizes the most important information about a model or object, such as aggregated data, information about referenced objects with charts etc. This information is presented in an easily understandable and visually appealing way. The Notebook, on the other hand, is a dedicated tool for editing and reading master data and contains no graphics. The Notebook is for data management, while an Insights dashboard is for reading and analysis.
Types of Insights Dashboards
The availability of Insights dashboards depends on the application library. In the ADONIS BPMS Application Library, Insights dashboards are enabled for:
the model type
 Business Process Diagram
ALL types of repository objects (for example
 Processes,
 Documents,
 Applications,
 Products,
 Roles,
 Organisational Units,
etc.)
Organisational Units,
etc.)
The Insights dashboard for ![]() Business Process Diagrams displays essential information about a specific business process.
Business Process Diagrams displays essential information about a specific business process.
All dashboards for objects contain the same set of default widgets that provide the user with summary data about the object. Some dashboards also have additional widgets.
Open Insights Dashboard
To open an Insights dashboard:
- Right-click the model or object, point to Open, and then click Insights
 .
.
You can open an Insights dashboard this way using e.g. the Explorer or a dashboard as a starting
point. Additionally, it is possible to open an Insights dashboard directly from the graphical editor
by clicking the Insights button ![]() .
.
Edit Attributes
To edit the attributes of the model or object that is open in the Insights dashboard:
- Click the More button
 at the
top right corner of the Insights dashboard, and then click Properties
at the
top right corner of the Insights dashboard, and then click Properties  .
.
The Notebook opens. If you have write access, you can edit the attributes.
Open in ADOIT
If an object was imported from ADOIT into ADONIS via the BOC Management Office Integration (MOI) interface, you can directly jump to the original object. To open the object in ADOIT:
- Click the ADOIT button
 at
the top of the Insights dashboard.
at
the top of the Insights dashboard.
ADOIT opens in a new browser tab.
Show/Hide Empty Sections
By default, all areas of an Insights dashboard for which no data is available are hidden. To show or hide empty sections:
- Click the More button at the
top right corner of the Insight:s dashboard, and then click Show empty sections.
Navigate in an Insights Dashboard
Use the quick links at the top left of the Insights dashboard to jump to the section you want to see:
Each link represents a category in the dashboard.
Choose a category first, and then select the widget you want from the drop-down menu.
If the category only holds one widget, the name of the widget is shown instead of the category name.
Available Functions
Across all widgets (= small program windows) of the various Insights dashboards various functions
are available. Click the More button
![]() to access these functions:
to access these functions:
Show a tooltip with information about the widget (icon
 )
)Export the content of a widget as a PDF file or Excel file (XLSX format) (icon
 )
)Refresh a widget to get the latest data (icon
 )
)Filter data in columns to show the elements you want and hide the rest:
Show or hide filters (icon
 )
)Clear all filters (icon
 )
)
Show or hide columns (icon
 )
)
Insights Dashboard for Business Process Diagrams
The Insights dashboard for ![]() Business Process Diagrams contains the following widgets:
Business Process Diagrams contains the following widgets:
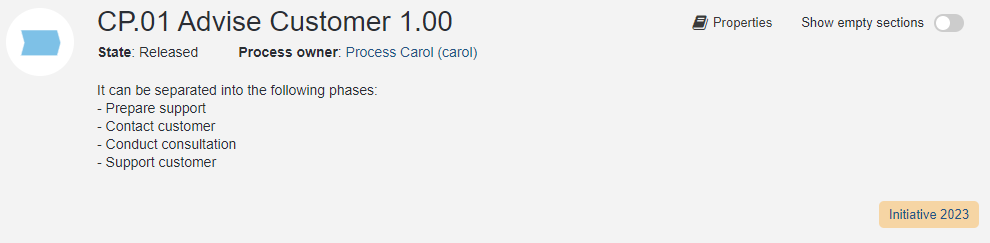
Header
The header of the Insights dashboard for
![]() Business Process Diagrams
is similar to the header used in other Insights dashboards (see here).
Business Process Diagrams
is similar to the header used in other Insights dashboards (see here).
The name of the Business Process Diagram is shown at the top. Beneath the name, you can see the
State, the Process owner and the Description of the model. If there are
![]() Labels that aggregate
this model, you will see a tag for each of them.
Labels that aggregate
this model, you will see a tag for each of them.
Process Hierarchy
This widget shows the parent processes as well as the child processes of the Business Process Diagram in the process hierarchy of the organisation (to better understand the context of the process currently being viewed).
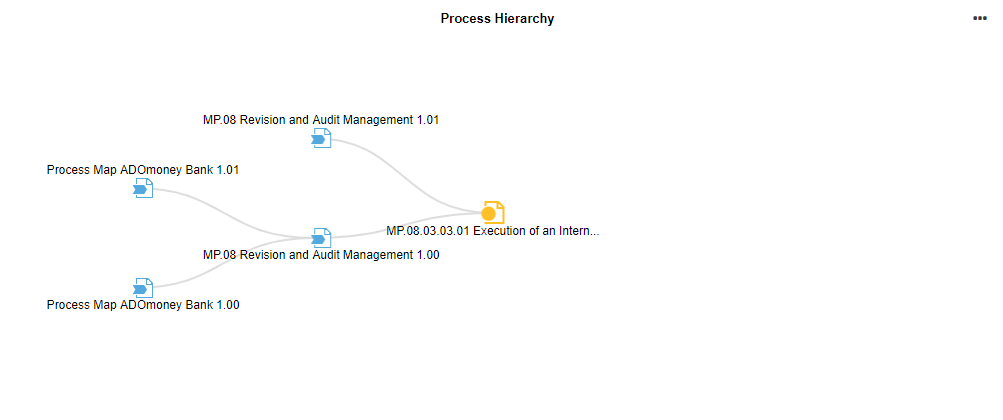
Each node represents a process. The centre node is the Business Process Diagram you are interested in. The incoming and outgoing relations are shown as branches, with the incoming paths to the left and the outgoing paths to the right.
The following options are available:
Click a node to collapse or expand a branch.
Click a node title to open the model.
SIPOC
The SIPOC widget enables you to analyse the process with a SIPOC table.
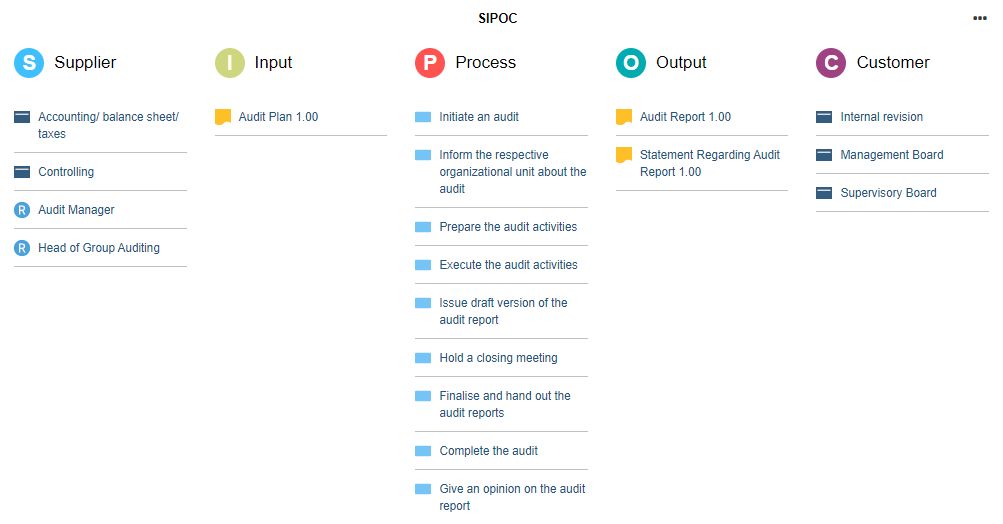
The acronym SIPOC stands for:
Supplier: The provider of inputs into a process.
Input: Materials, information and other resources needed to complete a process.
Process: Tasks used to convert inputs into outputs.
Output: Products or services resulting from the process.
Customer: Recipient of the outputs.
These 5 key elements form the columns of the table, where the focus is on summarizing the inputs and outputs.
What Data Is Displayed in the Columns?
Supplier: All External Partners, Organisational Units und Roles listed as Process suppliers for the Business Process Diagram.
Input: All Documents listed as Input for the Business Process Diagram or as Data input for the objects in the model.
Process: All Tasks contained in the Business Process Diagram.
Output: All Documents listed as Output for the Business Process Diagram or as Data output for the objects in the model.
Customer: All External Partners, Organisational Units und Roles listed as Process customers for the Business Process Diagram.
Note that suppliers and customers can be internal or external to the organization performing the process.
A SIPOC has its origins in TQM initiative and is still widely used today in Six Sigma, lean manufacturing and more general in business process management.
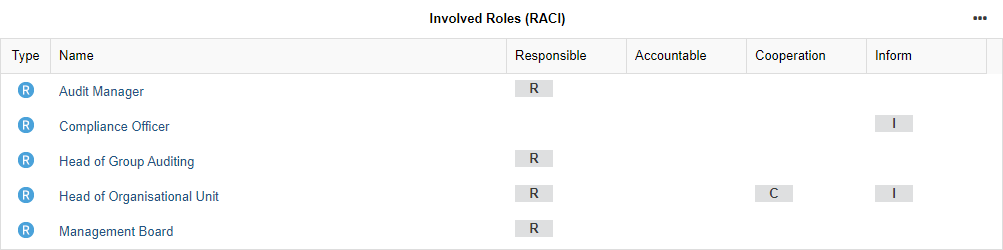
Involved Roles (RACI)
This table lists all Roles relevant for the process and their degree of responsibility and involvement.
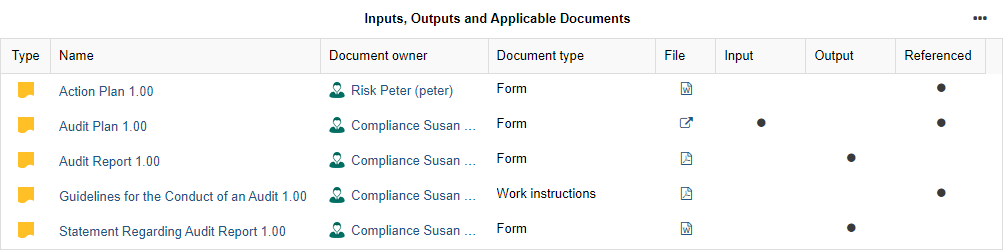
Inputs, Outputs and Applicable Documents
This table lists all Documents relevant for the process and whether they are classified as Input, Output or as Referenced documents. Additionally, the Document owner and Document type are shown. To view or download a document, click the icon in the File column.
Application Lifecycle
The pie chart in this widget shows you at a glance the current Lifecycle state of the Applications which are assigned to Tasks in the Business Process Diagram, or to the Business Process Diagram itself.
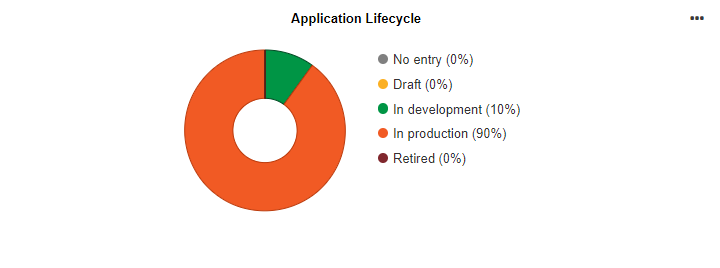
The following paths are evaluated:
Task
>Referenced applications/IT system elements>ApplicationBusiness Process Diagram
>Referenced applications/IT system elements>Application
By clicking a segment of the pie, you can highlight the corresponding Applications in the IT Systems and Resources table.
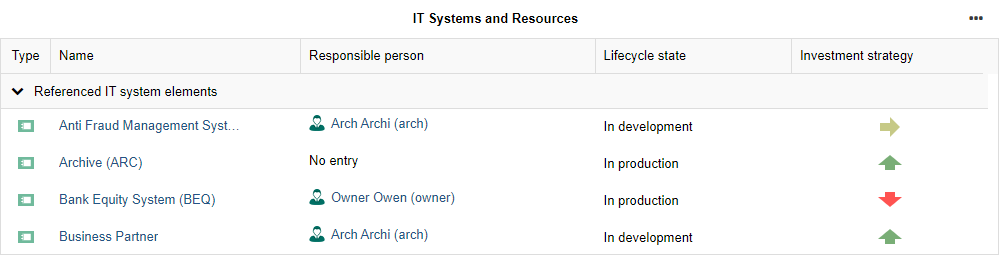
IT Systems and Resources
This table comprises all Applications, Services, Infrastructure Elements and Resources needed for running this process, and lists their attributes Responsible person, Lifecycle state and Investment strategy.
Process Potential and Maturity Analysis
This gauge chart shows the current value of the following attributes of the Business Process Diagram (one gauge for each attribute):
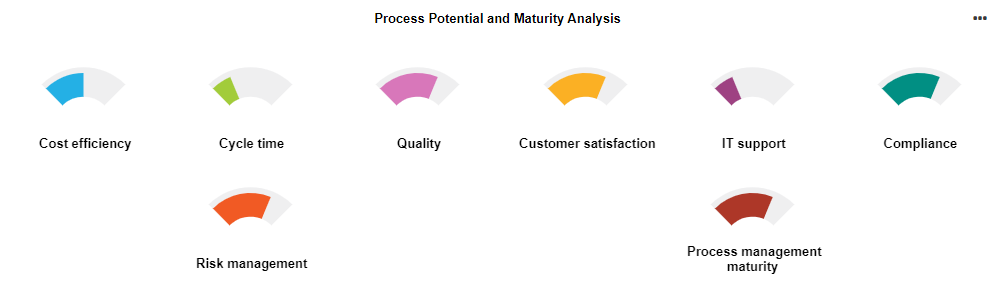
Cost efficiency
Cycle time
Quality
Customer satisfaction
IT support
Compliance
Risk management
Process management maturity
Move the mouse pointer over a gauge to display a tooltip with the exact percentage.
Risk and Control Overview
This table provides a compact overview of all relevant Risks as well as the assigned Controls mitigating the Risks.
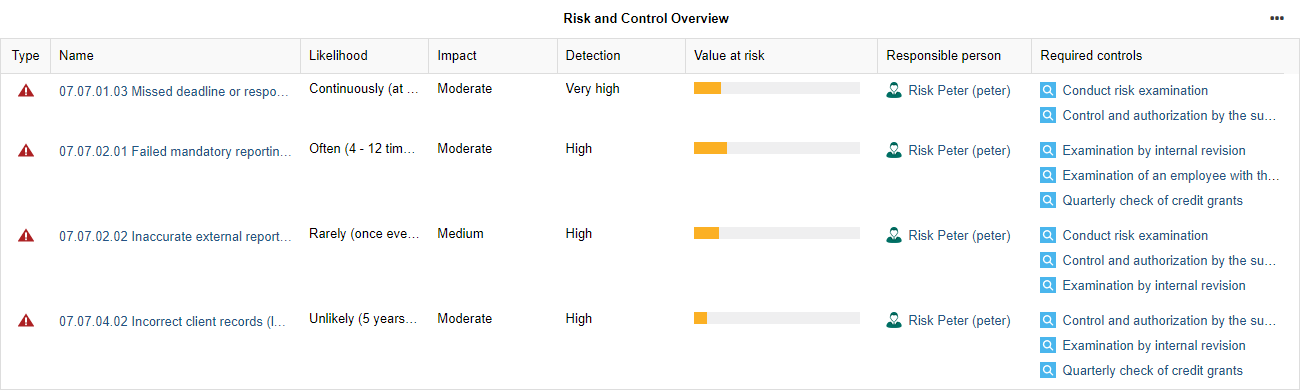
All in all, the following attributes are listed for each Risk:
Likelihood
Impact
Detection
Value at risk
Responsible person
Required controls
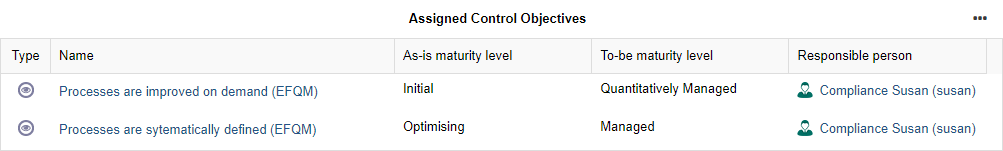
Assigned Control Objectives
This table provides an overview of the maturity level of the Control Objectives assigned to this process. The attributes As-is maturity level and To-be maturity level of the relation Assigned control objectives are evaluated for this purpose.
In addition, you can see who is assigned as Responsible person for the Control Objectives.
Key Performance Indicators
This table shows the current value of the following attributes of all Performance Indicators contained in the Business Process Diagram:

State
Current value
Target value
Unit
Periodicity
Initiatives
For all Initiatives assigned to this process, this table shows the current value of the following attributes:
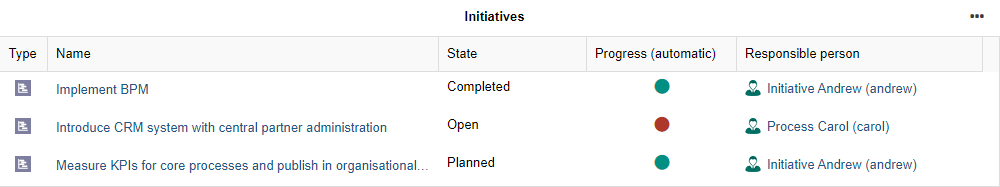
State
Progress (automatic)
Responsible person
Quick Access
The quick access area allows you to further explore details you are interested in.
This section describes the quick access area in the Insights dashboard for
![]() Business Process
Diagrams. If you want to know more about the quick access area in Insights dashboard for objects,
read on here.
Business Process
Diagrams. If you want to know more about the quick access area in Insights dashboard for objects,
read on here.
You can perform the following actions:
RACI Matrix: Analyse and visualise project roles and responsibilities.
QM report: Create a QM report containing information about responsibilities, scope, inputs, outputs, resources and the flow of the business process.
Model report: Create a report with all important information about the business process.
References: Show references of the business process.
Validation: Verify compliance with various guidelines and best practices.
Simulation: Simulate the execution of your business process to find out about cycle times, costs and resources.
Default Widgets for all Objects
Regardless of which object you choose, an Insights dashboard will always contain the default widgets, which are described in detail below.
Some dashboards also have additional widgets. See the sections about Roles , Organisational Units , Processes and Applications to find out more.
Header
The header is the area along the top of the dashboard.
The following information is displayed here:
the name of the object
the Process owner or Responsible person
the Description of the object
tags for all
 Labels
that aggregate this object
Labels
that aggregate this object
The tag colour can be set via the Colour attribute of the Labels.
Some dashboards show additional information:
- Processes show the
State
- Organisational Units
show the Type
- Roles show the number
of Assigned users (role holders)
Additionally, you can edit the attributes of the object that is open in the Insights dashboard and show or hide empty sections .
Relationships Network
This network diagram shows the currently viewed object and all related objects or models.
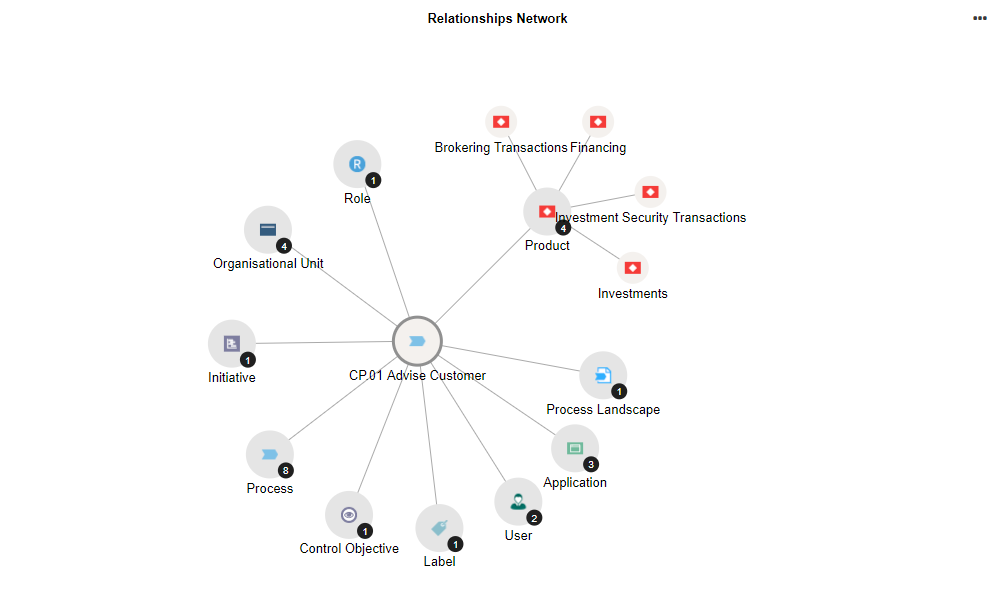
The following paths are evaluated:
Object
>any relation>'To' object or modelObject
<any relation<'From' object or model
The centre node is the currently viewed object, while the nodes around it represent related objects and models grouped by type. Click on such a node to show the individual artefacts.
If a node contains more than 10 child objects or models, the extra artefacts are not displayed. To display all artefacts, click Show All.
Related Initiatives
For all Initiatives assigned to this object, this table shows the current value of the following attributes:

State
Progress (automatic)
Responsible person
Assigned Risks
This table provides a compact overview of all relevant Risks as well as the assigned Controls mitigating the Risks.
This widget is not contained in the Insights dashboard for
![]() Roles.
Roles.
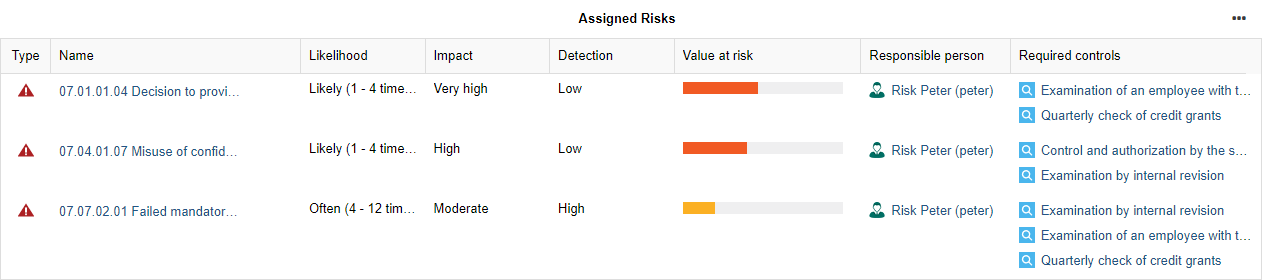
All in all, the following attributes are listed for each Risk:
Likelihood
Impact
Detection
Value at risk
Responsible person
Required controls
Assigned Control Objectives
This table provides an overview of the maturity level of the Control Objectives assigned to this object. The attributes As-is maturity level and To-be maturity level of the relation Assigned control objectives are evaluated for this purpose.
In addition, you can see who is assigned as Responsible person for the Control Objectives.

Timeline
This timeline shows the lifecycle of the currently viewed object.

You can see at a glance:
When the object becomes productive (valid from)
When the object is decommissioned (valid until)
Usage in Models
This table shows all models that contain the currently viewed object.

The table shows the following information:
the Last editor
the Date of last change
Quick Access
The quick access area allows you to further explore details you are interested in.
This section describes the quick access area in Insights dashboards for all types of objects. If you
want to know more about the quick access area in the Insights dashboard for
![]() Business Process
Diagrams, read on here.
Business Process
Diagrams, read on here.

You can perform the following actions:
Matrix [Roles & Organisational Units only]: Analyse and visualise responsibilities.
References: Show references of the object.
Analyse Dependencies [all except Roles & Organisational Units]: Analyse and visualise dependencies between objects across multiple layers.
Validation: Verify compliance with various guidelines and best practices.
Object Report: Create a report with all important information about the object.
Additional Widgets for Roles
The Insights Dashboard for ![]() Roles contains all default widgets and some additional widgets, which are described
in detail below.
Roles contains all default widgets and some additional widgets, which are described
in detail below.
Belongs to
For all Organisational Units to which the Role belongs, this table provides the following information:
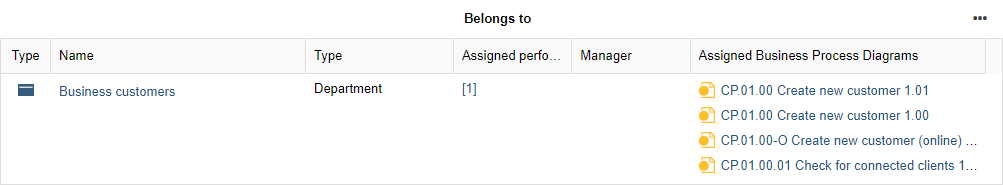
the Type of the Organisational Unit
the number of Assigned performers/users
the content of the Manager attribute
a list of all Assigned Business Process Diagrams
Assigned Tasks and Processes
For all Tasks assigned to the Role, this table provides the following information:
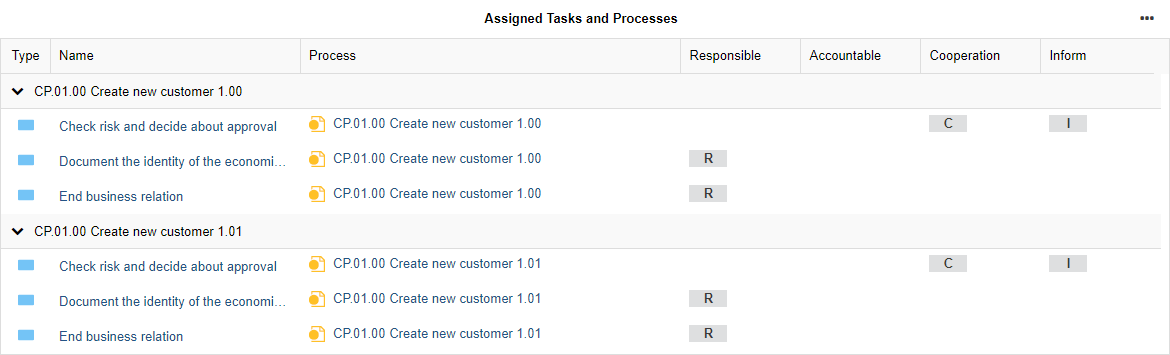
the model in which the Task is maintained
the responsibilities of the Role for each Task according to a RACI matrix
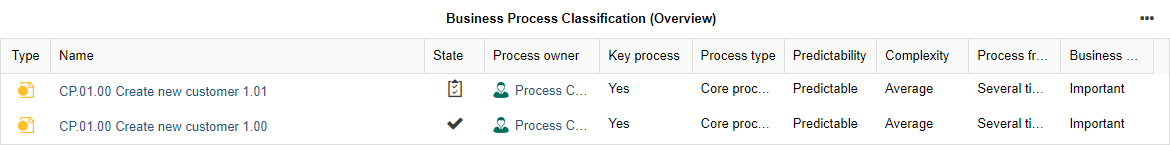
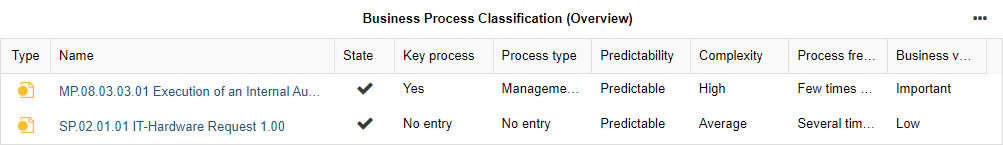
Business Process Classification (Overview)
This table lists all Business Process Diagrams which contain Tasks the Role is responsible for.
The following paths are evaluated:
- Role
<any RACI relation (Responsible, Accountable, Consulted or Informed)<Task<Business Process Diagram
All in all, the following attributes are listed for each Business Process Diagram:
State
Process Owner
Key process
Process type
Predictability
Complexity
Process frequency
Business value
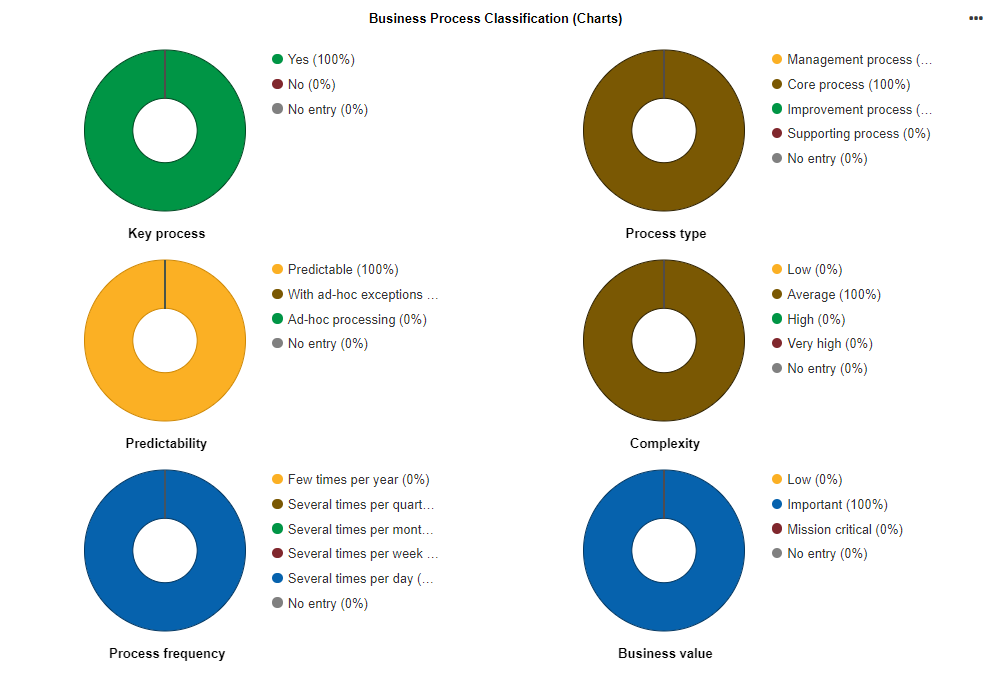
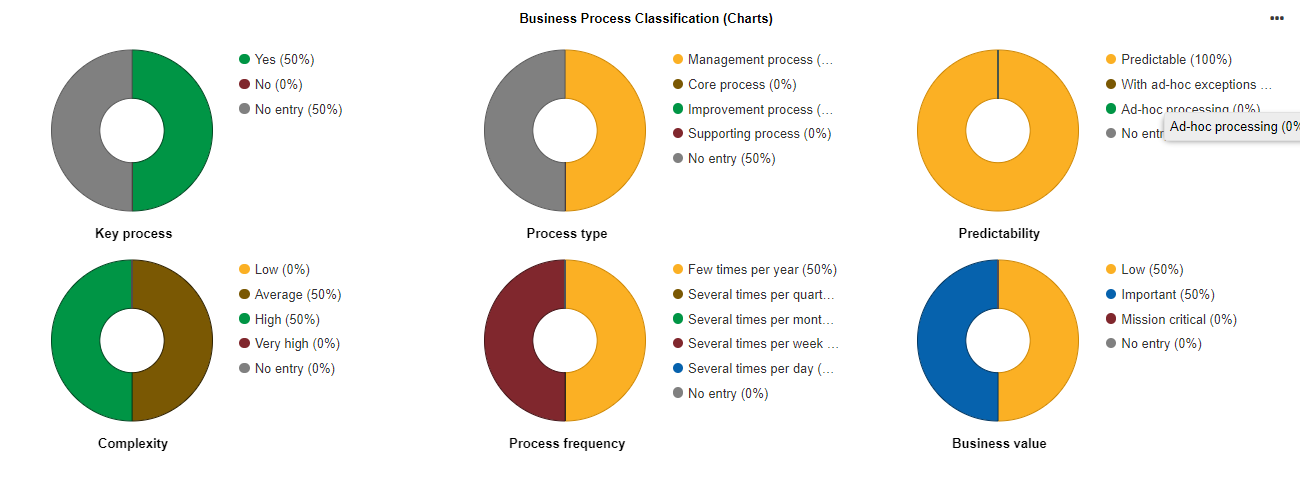
Business Process Classification (Charts)
This widget helps classify the Business Process Diagrams which contain Tasks the Role is responsible for.
The following paths are evaluated:
- Role
<any RACI relation (Responsible, Accountable, Consulted or Informed)<Task<Business Process Diagram
The pie charts show the distribution of a set of given values for the following attributes:
Key process
Process type
Predictability
Complexity
Process frequency
Business value
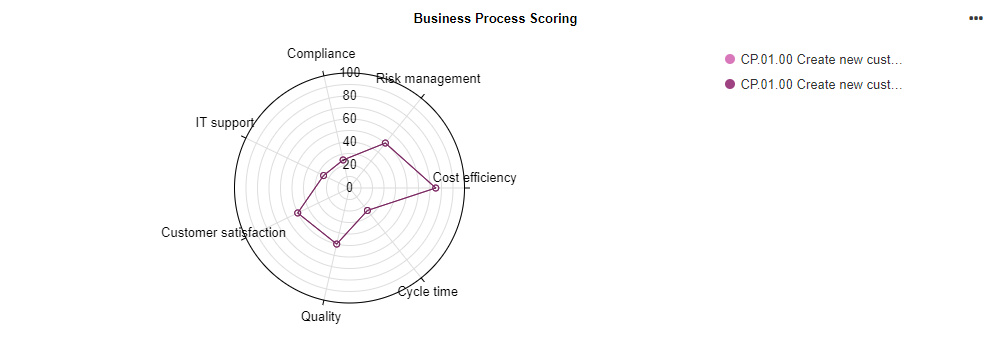
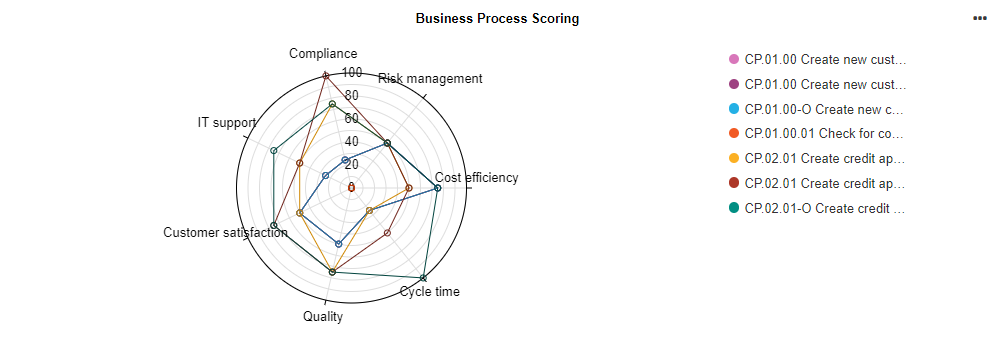
Business Process Scoring
This radar chart helps to analyse improvement potential in Business Process Diagrams based on a simple as-is assessment of the attributes Quality, Cycle time, Cost efficiency, Customer satisfaction, IT support, Compliance and Risk management.
The following paths are evaluated:
- Role
<any RACI relation (Responsible, Accountable, Consulted or Informed)<Task<Business Process Diagram
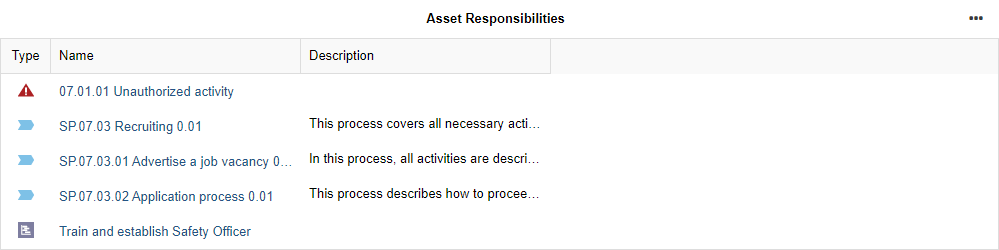
Asset Responsibilities
This table lists all repository objects the Role is responsible for.
Model Responsibilities
For all models assigned to the Role, this table provides the following information:
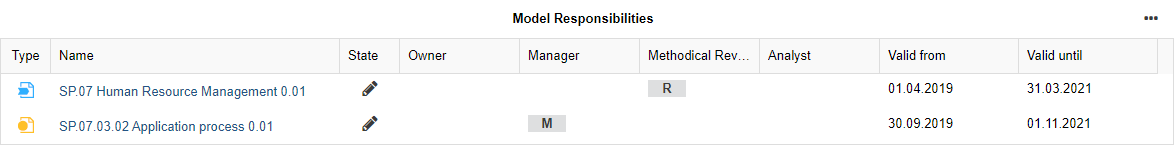
the State of the model
the responsibilities of the Role for each model according to an OMRA matrix (Process owner, Process manager, Methodical reviewer or Process analyst/designer)
the validity period of the model
Additional Widgets for Organisational Units
The Insights Dashboard for ![]() Organisational Units contains all default widgets and some additional widgets,
which are described in detail below.
Organisational Units contains all default widgets and some additional widgets,
which are described in detail below.
Assigned Roles
For all Roles assigned to the Organisational Unit, this table provides the following information:
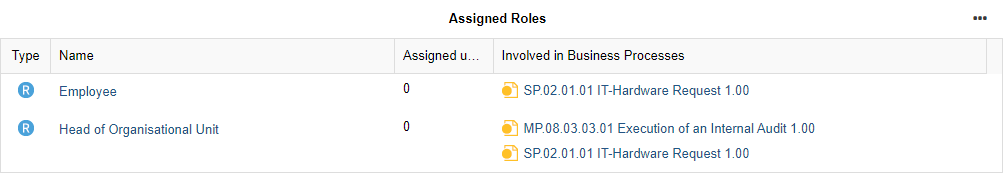
the number of Assigned users
the Business Process Diagrams each Role is responsible for according to a RACI matrix
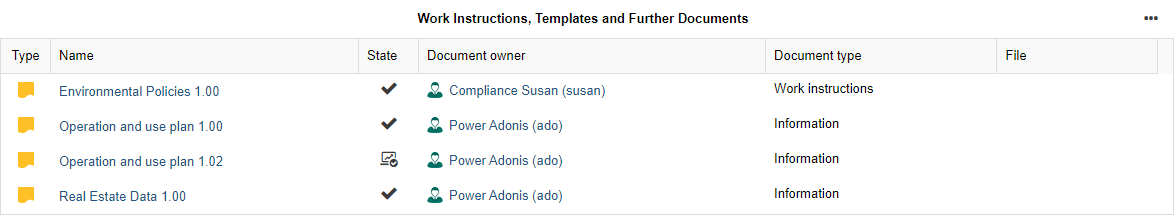
Work Instructions, Templates and Further Documents
This table lists all Documents which are referenced by the Organisational Unit. The Document owner and Document type are shown. To view or download a document, click the icon in the File column.
Assigned Business Processes - Key Facts
For all Business Process Diagrams assigned to the Organisational Unit, this table provides the following information:
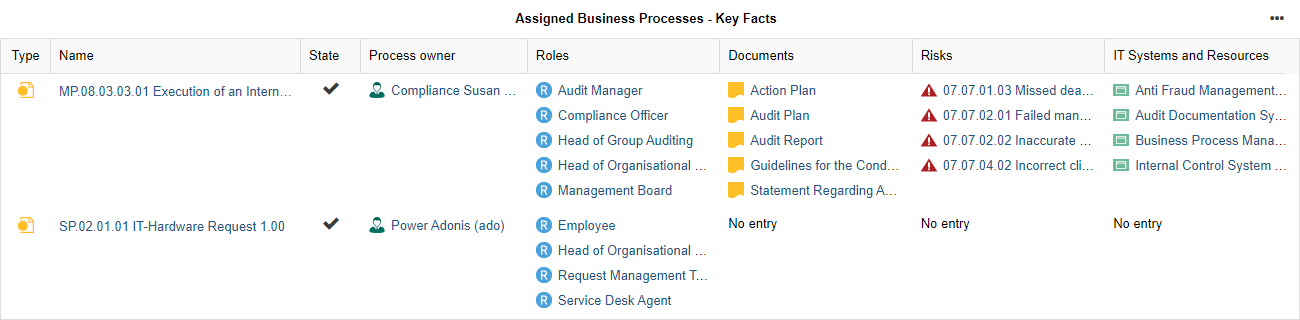
the State of the model
the Process owner of the model
all Roles which are responsible for Tasks in the process according to a RACI matrix
all Documents which are relevant for the process as Input, Output or as Referenced documents
all Risks that affect Tasks in the process, or the process itself
all Applications, Services, Infrastructure Elements and Resources which are assigned to Tasks in the process, or to the process itself
Business Process Classification (Overview)
For all Business Process Diagrams assigned to the Organisational Unit, this table lists the following attributes:
State
Key process
Process type
Predictability
Complexity
Process frequency
Business value
Business Process Classification (Charts)
This widget helps classify the Business Process Diagrams assigned to the Organisational Unit.
The pie charts show the distribution of a set of given values for the following attributes:
Key process
Process type
Predictability
Complexity
Process frequency
Business value
Business Process Scoring
This radar chart helps to analyse improvement potential in Business Process Diagrams assigned to the Organisational Unit based on a simple as-is assessment of the following attributes:
Cost efficiency
Cycle time
Quality
Customer satisfaction
IT support
Compliance
Risk management
Additional Widgets for Processes
The Insights Dashboard for ![]() Processes contains all default widgets and one additional widget, which is
described in detail below.
Processes contains all default widgets and one additional widget, which is
described in detail below.
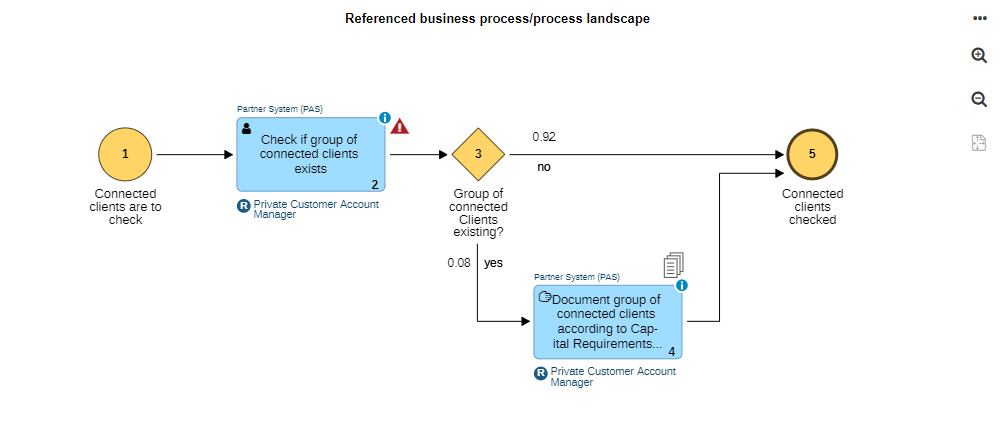
Referenced Business Process/Process Landscape
This widget shows the model that is referenced in the currently viewed Process.
The following path is evaluated:
- Process
>Referenced business process/process landscape>Business Process Diagram or Process Landscape
Additional Widgets for Applications
The Insights Dashboard for ![]() Applications contains all default widgets and some additional widgets, which are
described in detail below.
Applications contains all default widgets and some additional widgets, which are
described in detail below.
Lifecycle State & Investment Strategy
This widget is only available if an Application was imported from ADOIT into ADONIS via the BOC Management Office Integration (MOI) interface. It shows the current value of the following attributes of the Application:

Lifecycle State
Investment strategy
Technology Roadmap Status from ADOIT
This widget is only available if an Application was imported from ADOIT into ADONIS via the BOC Management Office Integration (MOI) interface. It shows all technologies which are used by the Application, grouped by their roadmap status. This information comes from ADOIT, where the Application is maintained.
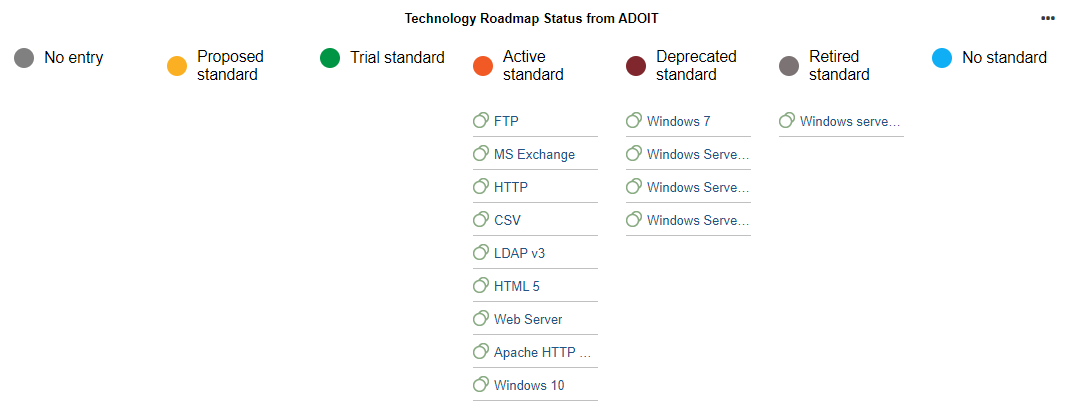
Open in ADOIT
To directly jump to the original technology in ADOIT:
- Click the hyperlinked name.