The "Design & Document" Scenario
The purpose of the "Design & Document" scenario is to let you model and create transparency in a structured way.
What you will see on the "Design & Document" start page
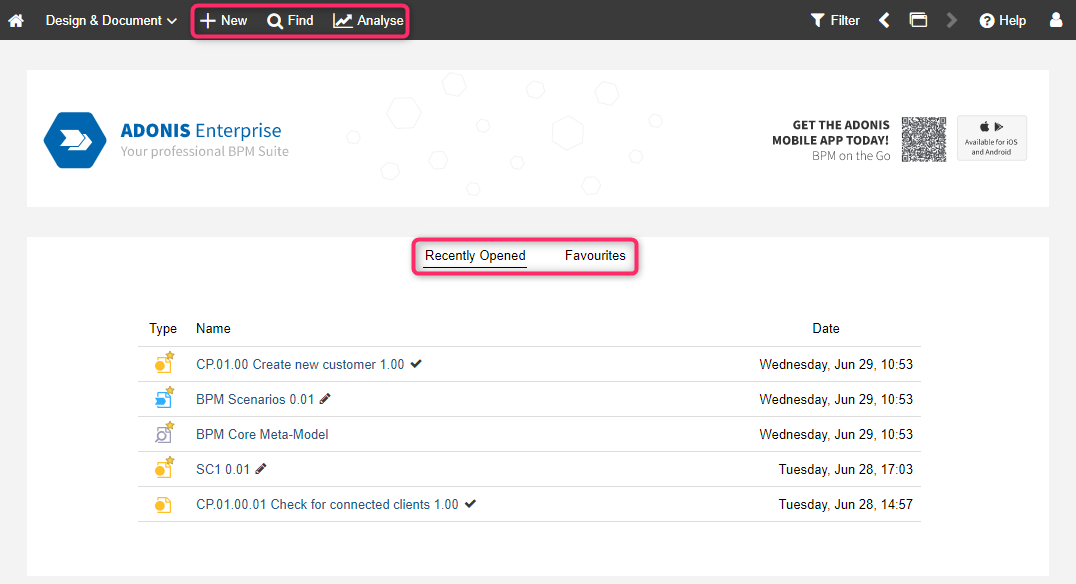
The start page has the following appearance:
Banner: The perfect place for an image that represents your organisation. Can be configured in the Administration Toolkit.
Recently opened: Your most recently opened models. Sorted by date, with the most recent model placed at the top. To see additional models, click Show more....
Favourites: Your favourite models and objects. Sorted alphabetically. To see additional artefacts, click Show more....
Additional Options
The toolbar at the top of the screen provides access to some of the most used features in ADONIS:
Find
 : Open the Explorer and the search function in ADONIS. Multiple
search and filtering options help you quickly find the artefact you are looking for.
: Open the Explorer and the search function in ADONIS. Multiple
search and filtering options help you quickly find the artefact you are looking for.Analyse
 : This page has three sections: Analyses, Reports and Dashboards. Use the quick links at the
top of the page to access these sections. The Analyses section serves as a
starting point to run analyses on a data set of your choice. The Reports section shows the
Reporting Board, where PDF and RTF reports can be created. The Dashboards
section provides access to the My Processes & Assets, Initiatives,
Risks, Compliance and News and Tasks dashboards.
: This page has three sections: Analyses, Reports and Dashboards. Use the quick links at the
top of the page to access these sections. The Analyses section serves as a
starting point to run analyses on a data set of your choice. The Reports section shows the
Reporting Board, where PDF and RTF reports can be created. The Dashboards
section provides access to the My Processes & Assets, Initiatives,
Risks, Compliance and News and Tasks dashboards.
My Processes & Assets
This dashboard contains the following widgets:
Processes
This widget provides a detailed overview of your processes. It lists all Business Process Diagrams, Process Landscapes and Process objects for which you are responsible. The processes are grouped by type and sorted alphabetically.
Select Attributes
By default, the following attributes are listed for each process:
State
Process type
Key process
Date of last change
Valid from
Valid until
Resubmission date
You can hide select attributes and show additional attributes:
- Click the More button
 at the
top right corner of the widget, point to Show/hide columns, and then select the attributes you
want.
at the
top right corner of the widget, point to Show/hide columns, and then select the attributes you
want.
Filter Processes
You can define what data is displayed in the "Processes" widget. This selection also determines which data is used as the basis for creating the charts in the "Statistics for my Responsibilities" and "Process Classification & Process Potential Analysis" widgets. To only display certain processes:
- Click the More button at the
top right corner of the widget, point to Process responsibilities, and then select the filter
you want.
All is the default filter. It lists all Business Process Diagrams, Process Landscapes and Process objects:
- For which you are assigned as Process owner, Process manager, Methodical reviewer or Process analyst/designer (attributes in the Notebook chapter "Organisation").
You can focus on one of these attributes by using the Process owner, Process manager, Methodical reviewer and Process analyst/designer filters.
Statistics for my Responsibilities
This pie chart shows the distribution of version states for your processes. It contains all Business Process Diagrams, Process Landscapes and Process objects for which you are assigned as Process owner or Process analyst/designer (attributes in the Notebook chapter "Organisation").
By clicking a segment of the pie, you can highlight the corresponding Business Process Diagrams and Process Landscapes in the Processes widget.
Process Classification
The radar chart Process Classification helps to analyse and classify your processes based on the attributes Predictability, Complexity, Process frequency, Business value and Process type.
Process Potential Analysis
The radar chart Process Potential Analysis helps to analyse improvement potential in your processes based on a simple as-is assessment of the attributes Quality, Cycle time, Cost efficiency, Customer satisfaction, IT support, Compliance, Risk management and Process management maturity.
My Assets
This widget provides a quick overview of your assets. It lists all repository objects for which you are assigned as Responsible person (object attribute in the Notebook chapter "Organisation").
Assets are grouped by type and sorted alphabetically. You can quickly evaluate the data actuality of your assets and generate reports.
KPI Overview
This bar chart allows you to find out quickly if your Performance Indicators meet their target values (based on an assessment of attributes in the Notebook chapter "Details").
More information about the calculation logic can be found in the info texts of the attributes in the chapter "Details".
KPIs
This widget provides a detailed overview of your Performance Indicators.
Filter KPIs
You can define what data is displayed here in the "KPIs" widget and in the "KPI Overview" widget. To only display certain Performance Indicators:
- Click the More button at the
top right corner of the widget, point to Ownership, and then select the filter you want.
KPIs (My) lists all Performance Indicators for which you are assigned as Responsible person (object attribute in the Notebook chapter "Organisation").
KPIs (In my processes) lists all Performance Indicators in Business Process Diagrams and Process Landscapes:
- For which you are assigned as Process owner, Process manager, Methodical reviewer or Process analyst/designer (model attributes in the Notebook chapter "Organisation").
KPIs (My & In my Processes) combines both options.
Initiatives
This dashboard contains the following widgets:
My Initiatives Statistics
The pie chart Initiative Progress provides an overview of the progress of your Initiatives. The progress is calculated automatically based on a comparison of the "as is" state against the "to be" state of the time, costs and efforts spent on an Initiative (object attribute Progress (Automatic) in the Notebook chapter "Controlling - Initiative").
The bar chart Initiative states categorizes your Initiatives based on their State (object attribute in the Notebook chapter "Controlling - Initiative").
My Initiatives - Radar
This radar chart helps to analyse and classify your Initiatives based on the attributes Planned costs, Current costs, Planned effort, Current effort and Degree of completion (object attributes in the Notebook chapters "General information" and "Controlling - Initiative").
My Initiatives
This widget provides a quick overview of your Initiatives. It lists all Initiatives for which you are assigned as Responsible person (object attribute in the Notebook chapter "Organisation").
You can see at a glance the progress of the Initiatives listed here. Additionally, you can quickly evaluate the data actuality of the listed Initiatives.
Risks
This dashboard contains the following widgets:
ICS Statistics
The first pie chart in this widget shows the distribution of risk assessment values for your Risks. The Value at risk is calculated based on the Likelihood, Impact and Detection values of a Risk (object attributes in the Notebook chapter "Risk assessment").
The second pie chart shows the distribution of Control methods for your Controls (object attribute in the Notebook chapter "General information").
Risk Management Indicators
The first indicator gauge in this widget shows the average value of the Value at risk attribute across your Risks (object attribute in the Notebook chapter "Risk assessment").
The second and third indicator gauges show the average values of the Design Effectiveness and Operating Effectiveness attributes across your Controls (object attributes in the Notebook chapter "Control assessment").
My Risks
This widget provides a quick overview of your Risks. It lists all Risks for which you are assigned as Responsible person (object attribute in the Notebook chapter "Organisation").
The risks are grouped according to their Risk Group (object attribute in the Notebook chapter "General information").
You can see at a glance the severity of the Risks listed here. Additionally, you can quickly evaluate the data actuality of the listed Risks.
Control Frequency
This bar chart categorizes your Controls based on the Frequency of control execution (object attribute in the Notebook chapter "General information").
My Controls
This widget provides a quick overview of your Controls. It lists all Controls for which you are assigned as Responsible person (object attribute in the Notebook chapter "Organisation").
Additonally, you can quickly evaluate the data actuality of the listed Controls here.
Compliance
This dashboard contains the following widgets:
Compliance Statistics
The pie chart Action required shows for all combinations of Control Objectives and assets to what extent there is a need for action (attribute Action required in the Notebook of the reference Assigned control objectives, chapter "General information").
The bar chart Maturity Assessment provides an overview of the maturity level of your Control Objectives by evaluating their assets according to specific categories: undermatch, match, overmatch. The maturity level is calculated automatically based on a comparison of the "as is" state against the "to be" state (attributes As-is maturity level and To-be maturity level in the Notebook of the reference Assigned control objectives, chapter "Maturity Assessment").
My Control Objectives
This widget provides a quick overview of the assets of your Control Objectives. It lists the assets of all Control Objectives for which you are assigned as Responsible person (object attribute in the Notebook chapter "Organisation").
Assets are repository objects which are connected to your Control Objectives by the reference Assigned control objectives. In the widget, the assets are grouped according to their Control Objective.
For each combination of Control Objective and asset, you can see whether an action is required and what the maturity assessment of that combination is (attributes in the Notebook of the reference Assigned control objectives, chapters "General information" and "Maturity assessment"). Additionally, you can quickly evaluate the data actuality of the listed assets.
News and Tasks
This dashboard provides a detailed overview of the most recent changes in models and objects in the database and your tasks.
Task Options
In order to access the task options:
- Click the widget title (button
 )
to open a drop-down menu.
)
to open a drop-down menu.
The drop-down menu offers the following options:
Create new task
Mark selected task(s) as read
Mark selected task(s) as unread
Hide or show done tasks
Mark selected task(s) as done
Mark selected task(s) as undone
Delete selected tasks