Process mining in ADONIS PME
As described in the Capabilities of ADONIS PME section, the Process Mining Essentials add-on provides three core capabilities:
When you open a process mining project in ADONIS PME, you’ll see a dashboard with three tabs - each representing one of these capabilities.
Process performance management
Process performance management is accessible via the Overview tab of the process mining dashboard.
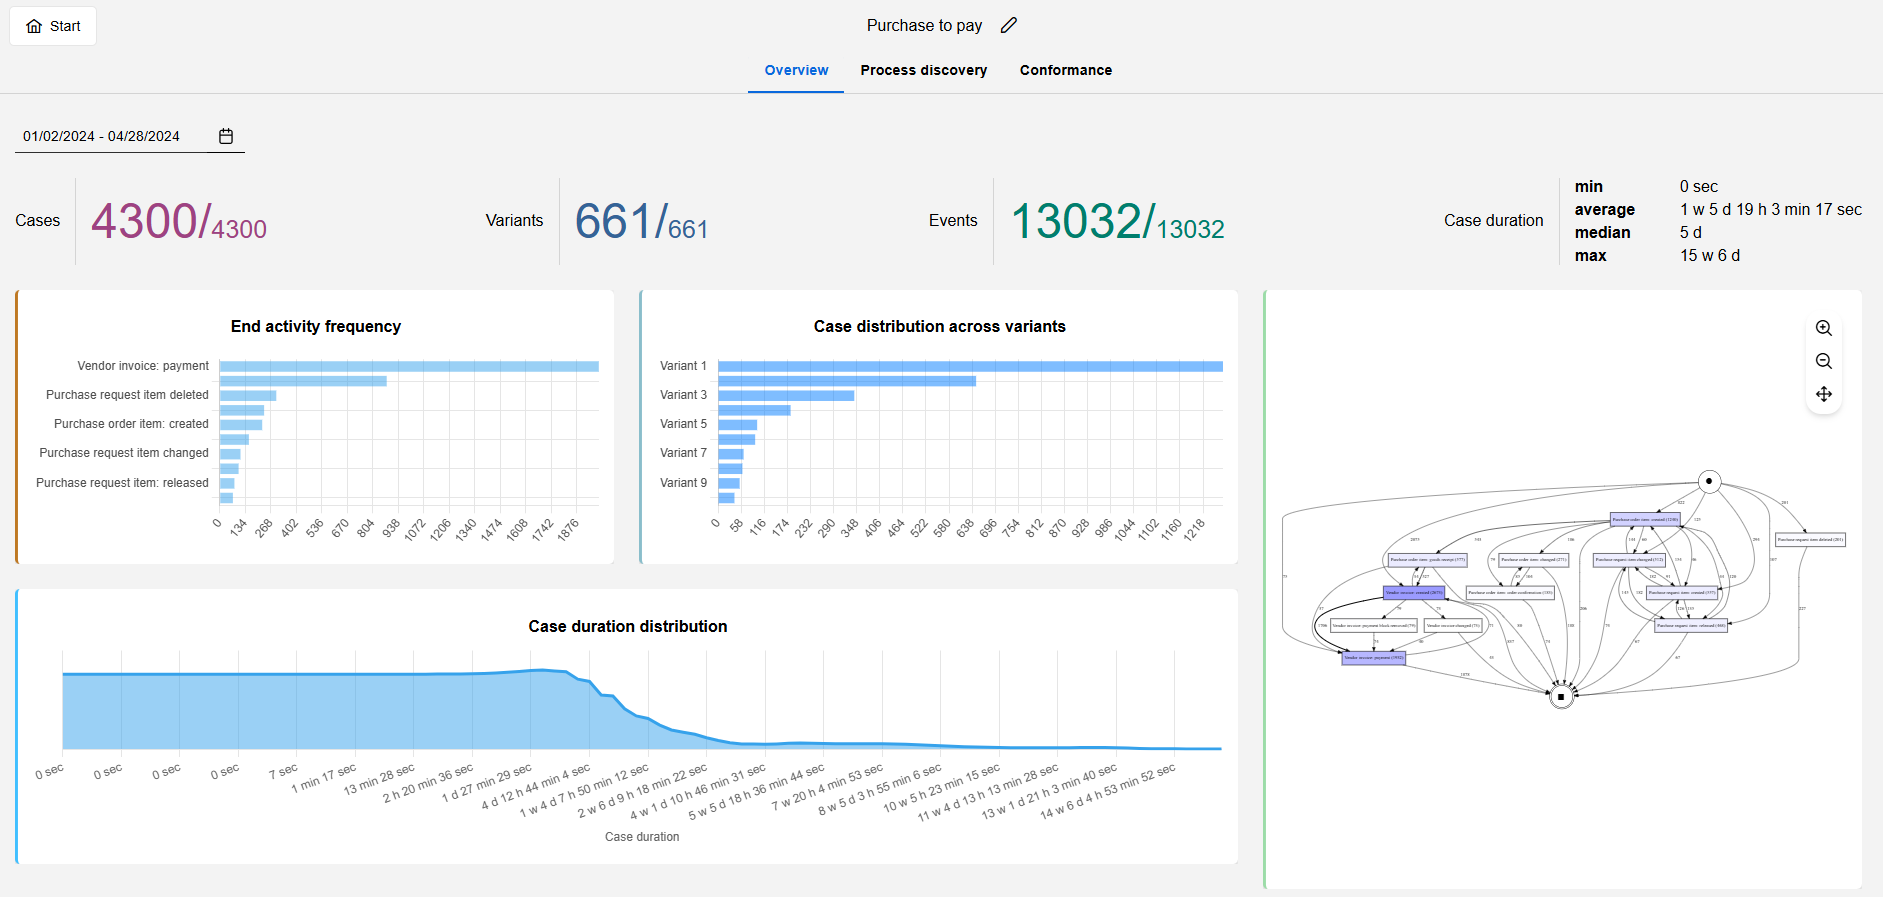
In the upper-left corner, you’ll find the Choose date box, where you can define a time period to restrict the analysis to. If you do not define a time period, the entire event log will be analysed.
Please note that the time period specified for the event log examination will be saved and will be applied to all the other tabs as well.
Cases
Shows the number of cases within the selected time period (left number) and in the complete event log (right number).
A case in process mining refers to an instance or occurrence of a business process. It represents the journey of a specific entity, such as a customer order or service request, through the various activities defined in the process. Understanding cases is essential for analysing the paths and variations within a process.
Variants
Shows the number of unique process variants within the selected time period (left number) and in the complete event log (right number).
Variants represent the different paths or sequences of activities that cases can take within a business process. Analysing process variants helps organizations understand the diversity and complexity of their processes, allowing for targeted improvements and optimisation efforts.
Events
Shows the number of events in the event log within the selected time period (left number) and in the complete event log (right number).
An event or activity in process mining represents a specific step or task within a business process. It is a fundamental unit of work that can be observed and recorded in an event log. Identifying and understanding activities is crucial for process analysis and improvement.
Case duration
Case duration is the total time taken for a specific case to move through a business process from start to finish. Process mining analyses case durations to identify inefficiencies, delays, and opportunities for improvement in order to streamline processes and enhance overall performance.
ADONIS PME provides four key duration metrics:
- Minimum case duration
- Average case duration
- Median case duration
- Maximum case duration
End activity frequency
This chart shows how often different end activities or final events occur across all process instances.
It helps to understand which outcomes or process conclusions are most common and can provide insight into how often a process successfully completes versus how often and where it may deviate or fail to finish. This analysis can provide valuable insights into process performance, such as identifying bottlenecks, deviations, or areas where processes fail to reach their intended conclusion.
Case distribution across variants
This chart shows how process instances (cases) are distributed across different process variants or paths.
Each variant represents a unique sequence of activities or events that a case follows to completion. The chart typically shows the frequency or proportion of cases that follow each variant, allowing you to identify the most common process routes, as well as any less frequent or exceptional paths. This analysis can help uncover inefficiencies, deviations, or opportunities for standardization in the process by revealing how much variation exists in the way cases are handled.
Case duration distribution
This chart shows how case durations are spread across the dataset, from fastest to slowest.
This visualisation helps identify trends in case completion times, such as common processing durations, delays, or outliers. By analysing this distribution, process analysts can pinpoint inefficiencies, potential bottlenecks, and opportunities for process optimisation based on how long cases typically take to resolve.
Directly-Follows Graph (DFG)
The Directly-Follows Graph (DFG) is a visualisation that maps the direct flow of activities within the process:
Each activity is a node.
Arrows represent transitions between them.
Numbers indicate how often an activity occurs.
Thicker arrows mean more frequent transitions.
This graph is ideal for spotting frequent paths, dependencies, and potential inefficiencies in process flows.
In the Overview tab, the DFG provides a high-level view of the process structure. For more in-depth exploration, head over to the Process discovery tab. There, you can tailor the graph view and refine your analysis.
Process discovery
Process discovery is one of the three main capabilities ADONIS PME offers, and it’s available on the Process discovery tab of the process mining dashboard.
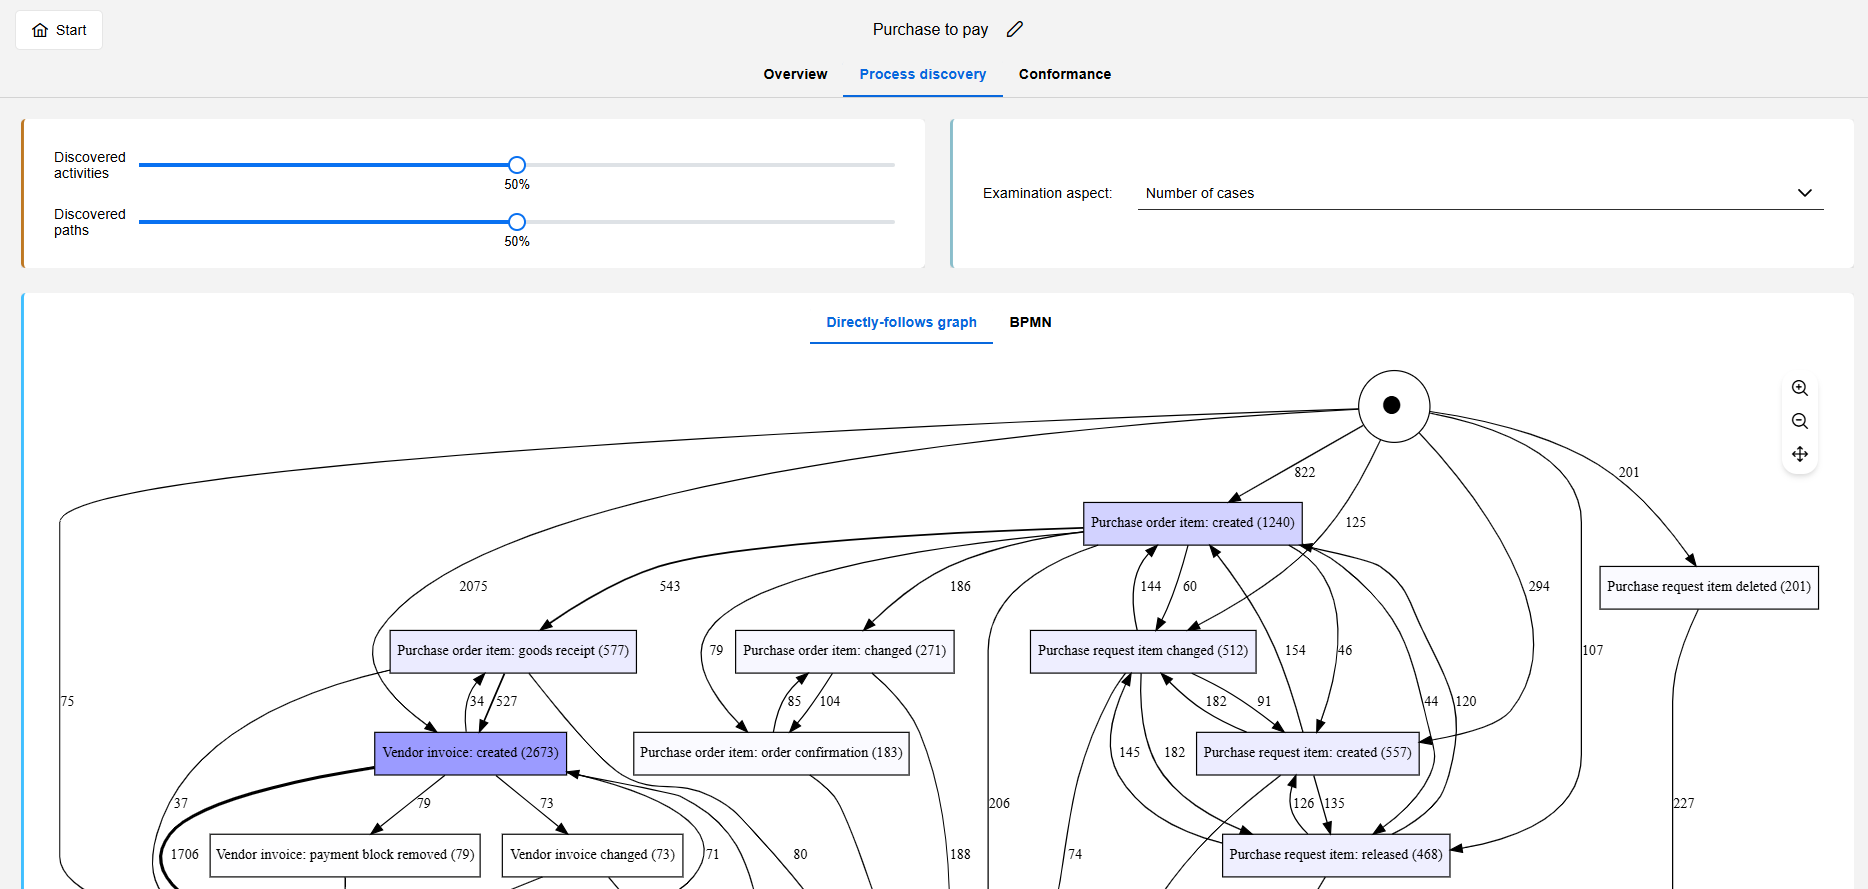
This tab is divided into two main sections:
Directly-Follows Graph/BPMN: This is the central element of the tab, showing the calculated process model. Depending on your preference and settings, the model can be visualised:
as a Directly-Follows Graph (DFG) (see the previous section), or
as a BPMN Diagram
Control elements: These controls let you fine-tune what’s shown in the central view. By default, not all activities or paths may be visible in the process model. The initial view emphasises the most frequent paths and common activities. You can adjust the visibility of the graph or diagram and tailor it according to your needs.
Process discovery using the Directly-Follows Graph
When using the DFG (which is the default view in the Process discovery tab), several control elements help you adjust the visual output.
Adjust discovered activities and paths
You can adjust the discovered activities and paths with the help of the Discovered activities and Discovered paths sliders near the upper-left corner.
By default, both sliders will be set to 50%, and based on the purpose of the analysis, you can decrease or increase the percentages. To help you understand, here are some examples:
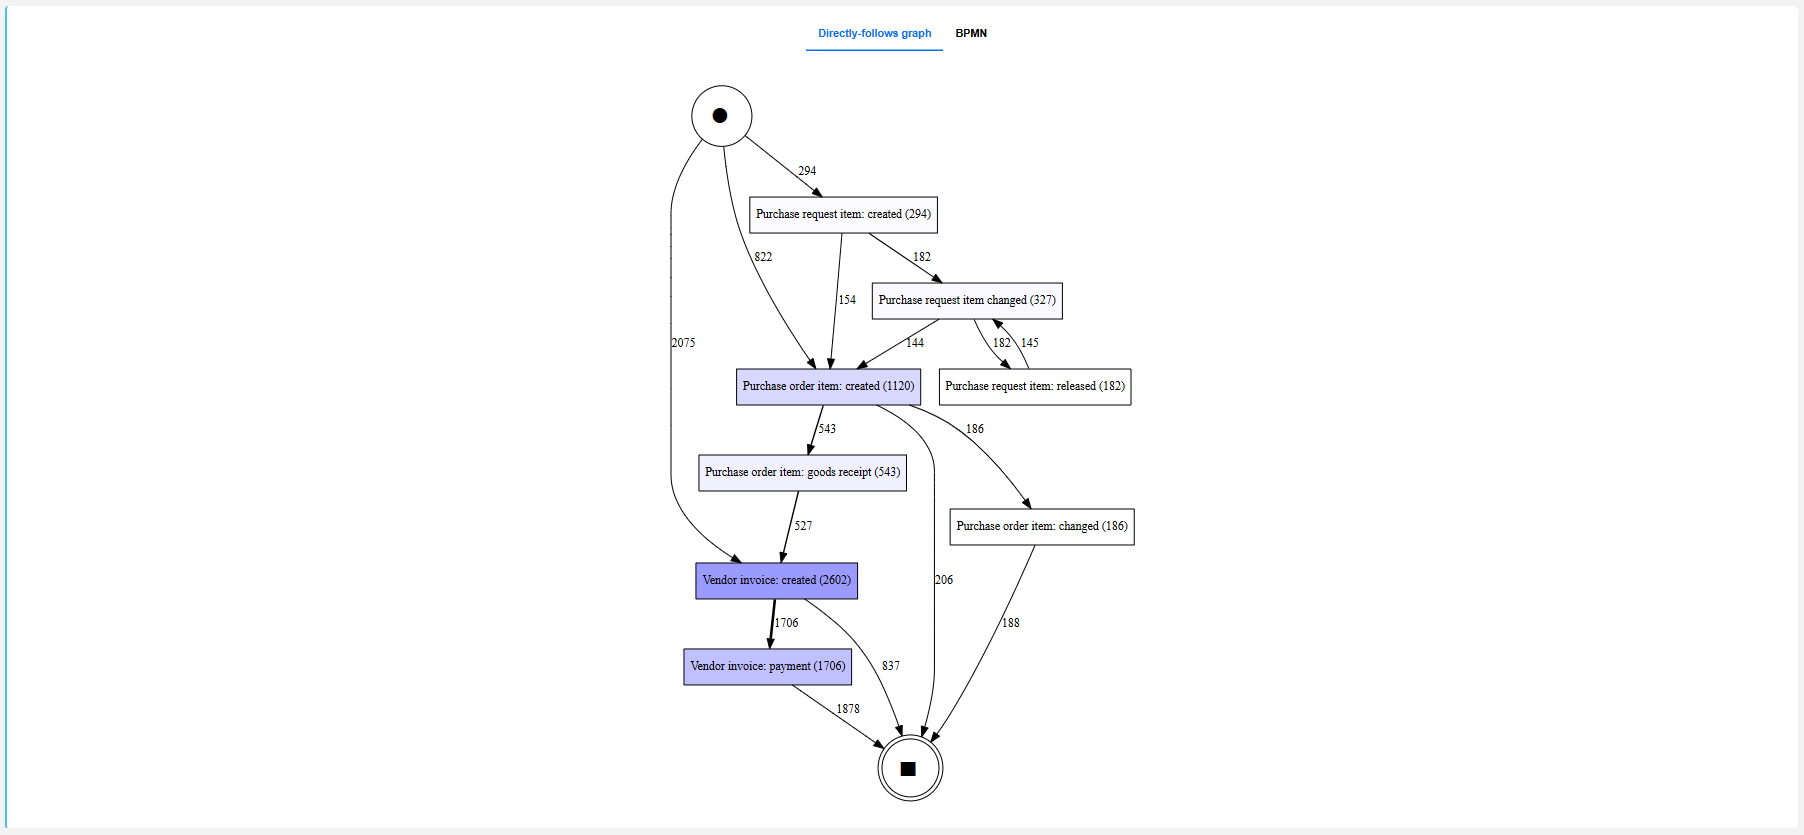
- Decreasing discovered activities: Let's assume that you are only interested in the most common activities that occurred in the event log. In this case, the percentage of the discovered activities should be decreased (the Discovered activities slider should be moved to the left).

- Increasing discovered paths: Let's assume that you are interested in every single path that occurred in the event log. In this case, the percentage of the Discovered paths should be increased (the corresponding slider should be moved to the right).
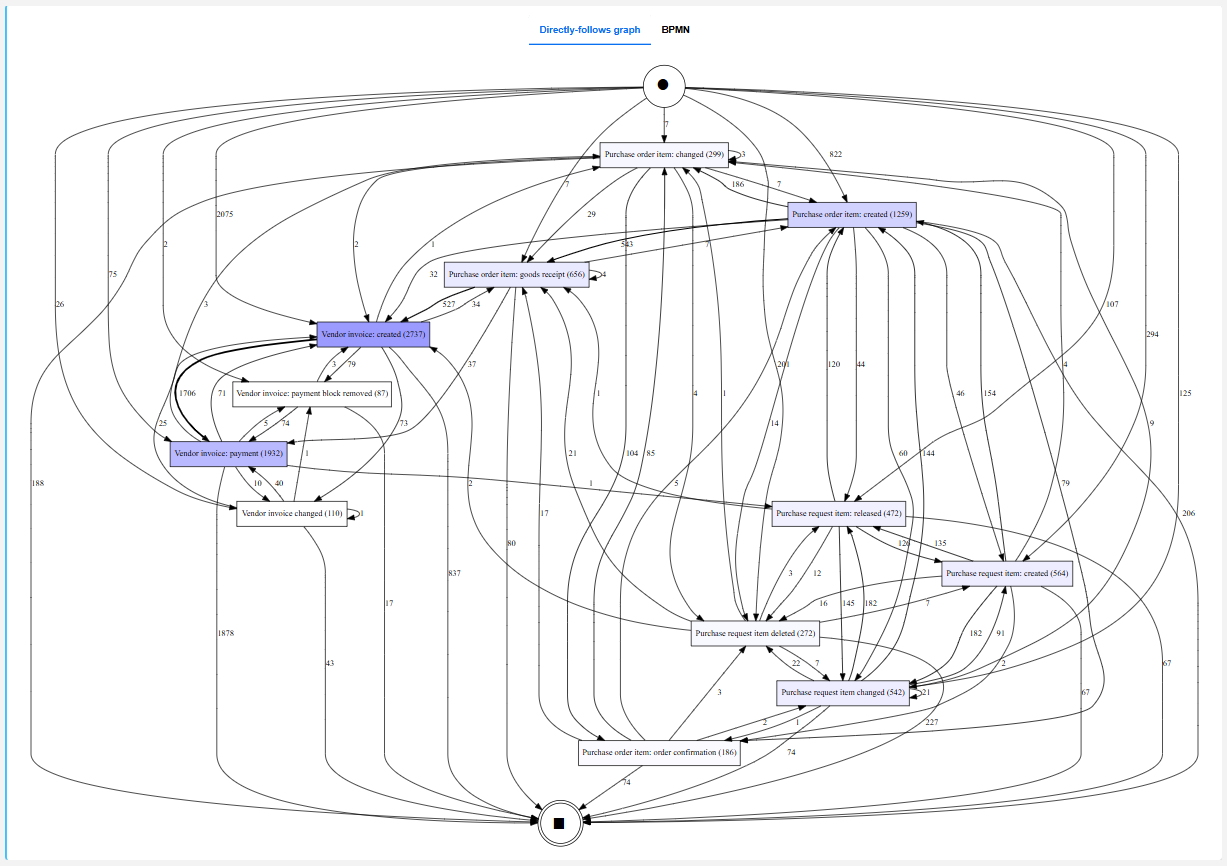
The ability to adjust the discovered paths and activities displayed in the DFG allows you to refine and focus the analysis by increasing or decreasing the level of detail shown. Filter out less relevant or infrequent paths and activities, thereby making the graph more interpretable and aligned with the specific goals of the analysis. By focusing on the most significant or common sequences, organizations can gain clearer insights into process inefficiencies, bottlenecks, or deviations, improving decision-making and process optimisation.
Set examination aspect
You can change what kind of data the DFG is based on, using the Examination aspect setting.
You can choose from the following aspects:
- Number of cases (default): Displays how often each activity and path occurs.
Time-based views: These show how long different paths take. Options include:
Mean time
Maximum time
Median time
Minimum time
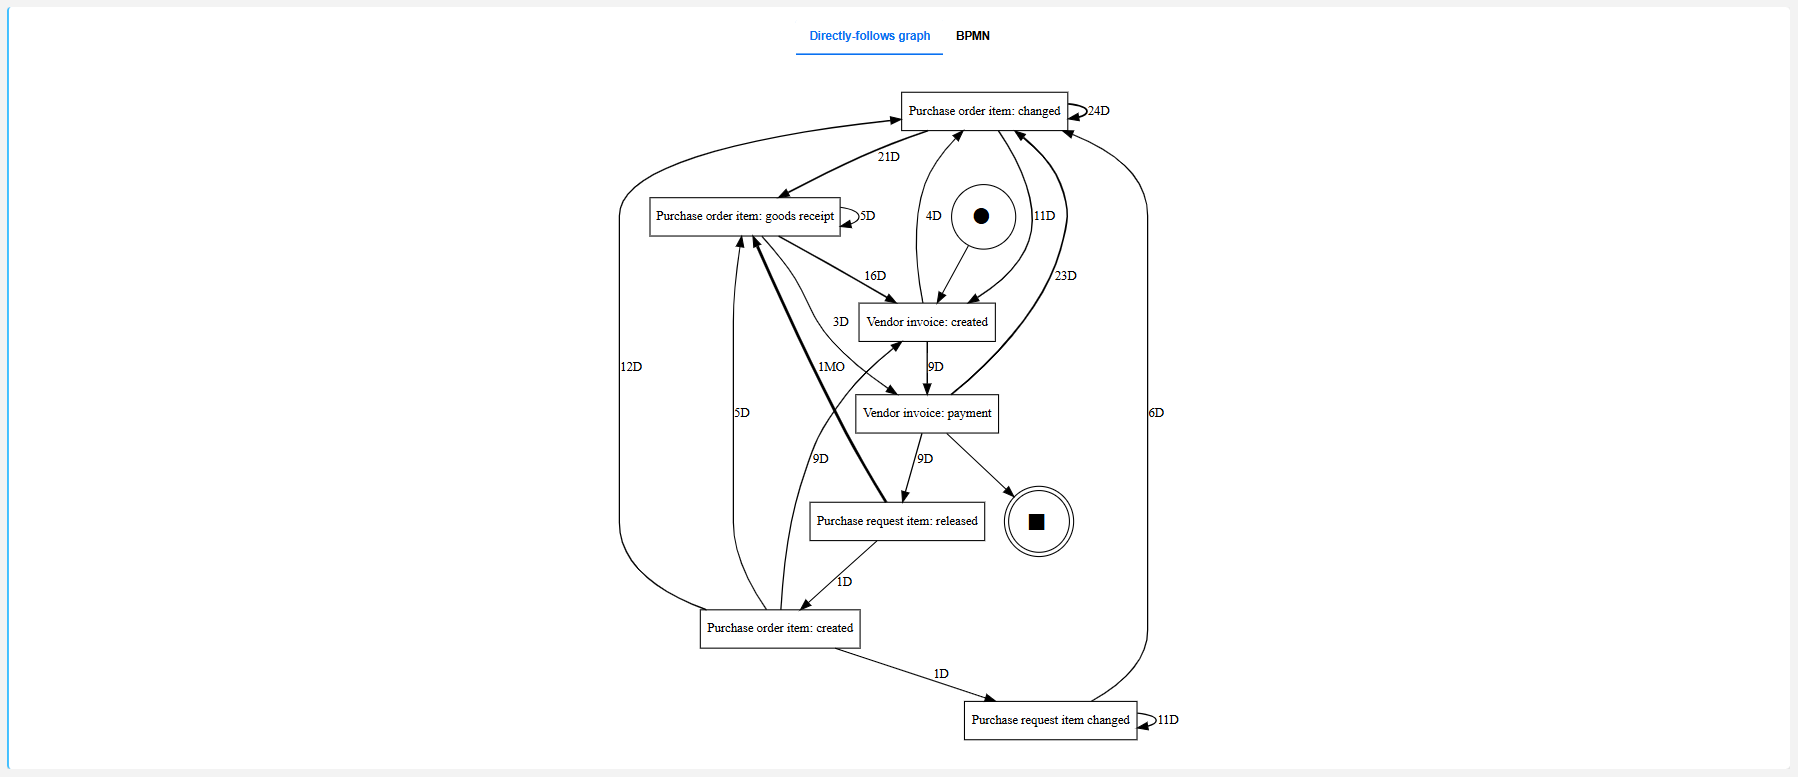
The ability to set the examination aspect to display time durations of the paths in the DFG allows you to visualise how long each sequence of activities takes within the process. This feature highlights time-related performance aspects, such as delays or bottlenecks, helping to identify areas where the process may be inefficient or where time-based improvements are needed. By analysing time durations alongside the process flow, organisations can make data-driven decisions to optimise throughput, reduce cycle times, and enhance overall process efficiency.
Process discovery using the BPMN Diagram
When using the BPMN Diagram instead of the DFG, one key control allows you to adjust the level of detail.
Adjust percentage of cases
You can change how many cases are reflected in the BPMN diagram. This helps you focus on either the most common process flows or explore all existing variations.

Additionally, ADONIS PME allows exporting the generated BPMN process model in BPMN DI format. You can re-import this model into ADONIS or share it with stakeholders. To do this, click the Export button.
Conformance checking
Conformance checking is one of the three main capabilities ADONIS PME offers, and is accessed through the Conformance tab of the process mining dashboard.
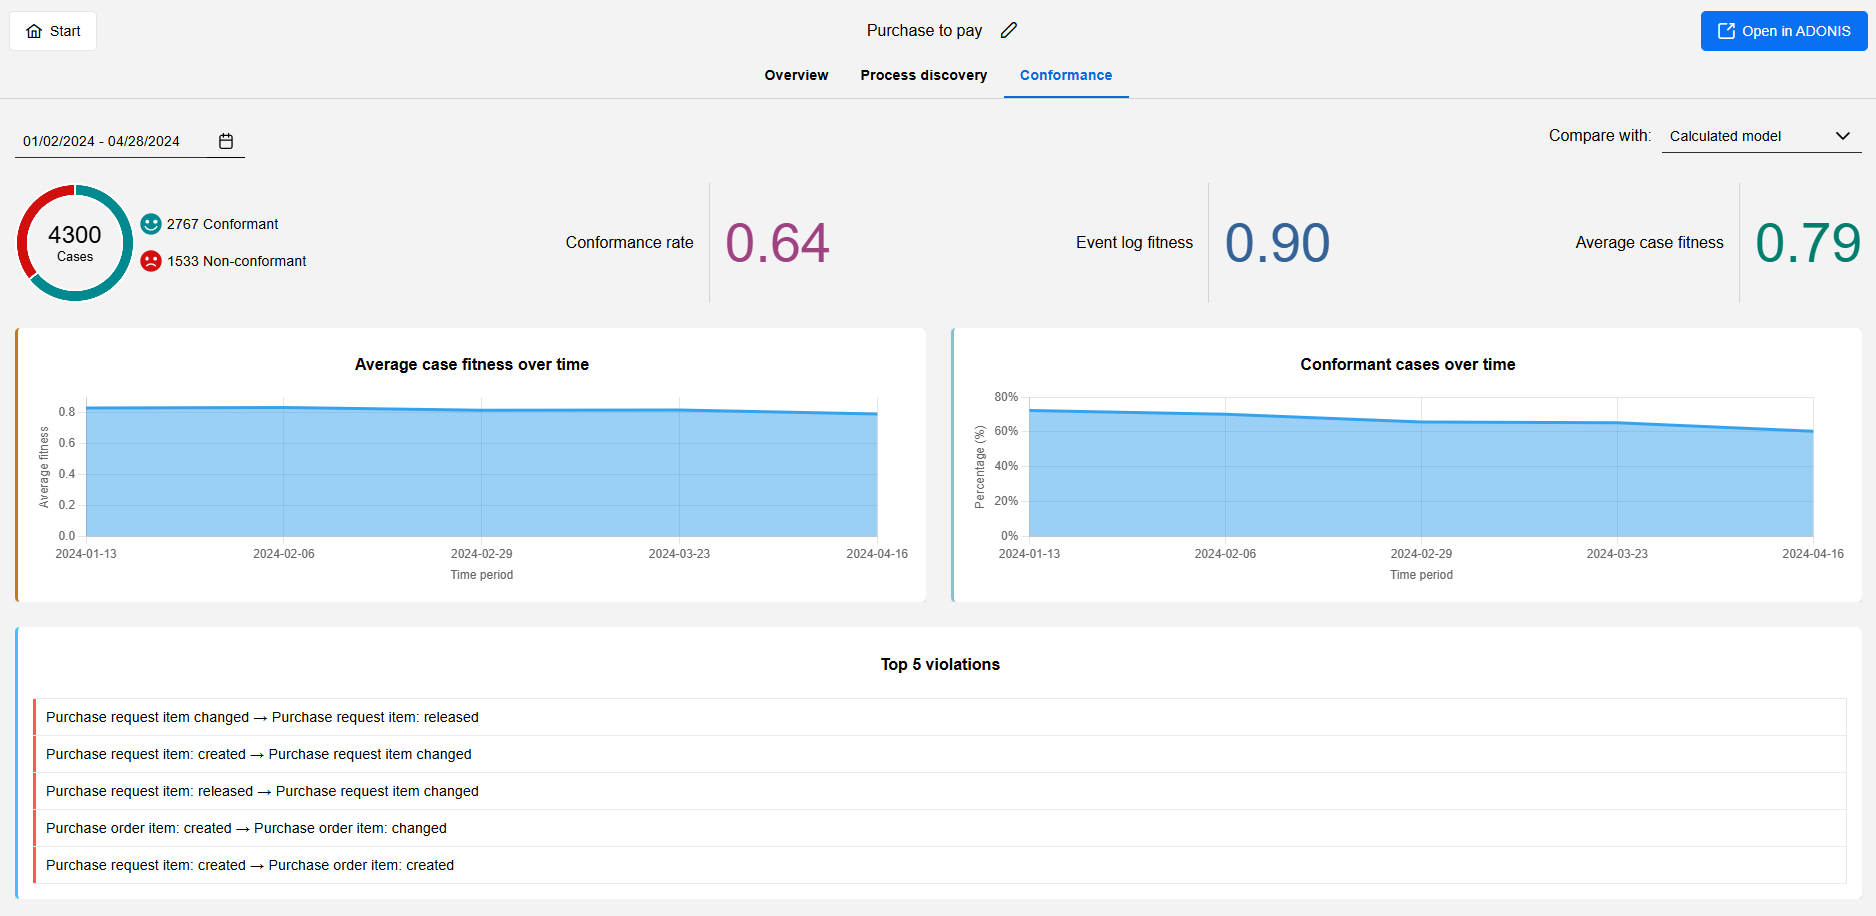
Use the Choose date box in the top-left corner to define a time period to restrict the analysis to. If you do not define a time period, the entire event log will be analysed.
Select comparison model
Conformance checking compares the observed behaviour from the event log with a process model.
Depending on your ADONIS version and project setup, one or two comparison options may be available to populate the metrics on the dashboard:
Compare with calculated model (all versions)
Compare with linked model (ADONIS 18.0 or higher, if a model is linked)
Changing the comparison model resets the selected date range.
Compare with calculated model
This is the default option for all ADONIS versions and the only option available in older ADONIS versions or when no model is linked.
The observed behaviour from the event log is compared with the calculated process model, that is, the model automatically discovered from the event log data. You can view this model on the Process discovery tab.
Compare with linked model
If a Business Process Diagram is linked to the process mining project (see ADONIS integration), it can be used as the basis for conformance checking instead of the calculated model.
To enable this comparison:
- From the Compare with list in the top-right corner, select Linked Model.
The Compare with linked model dialogue opens and shows the matching status of task names between the linked Business Process Diagram and the event log.
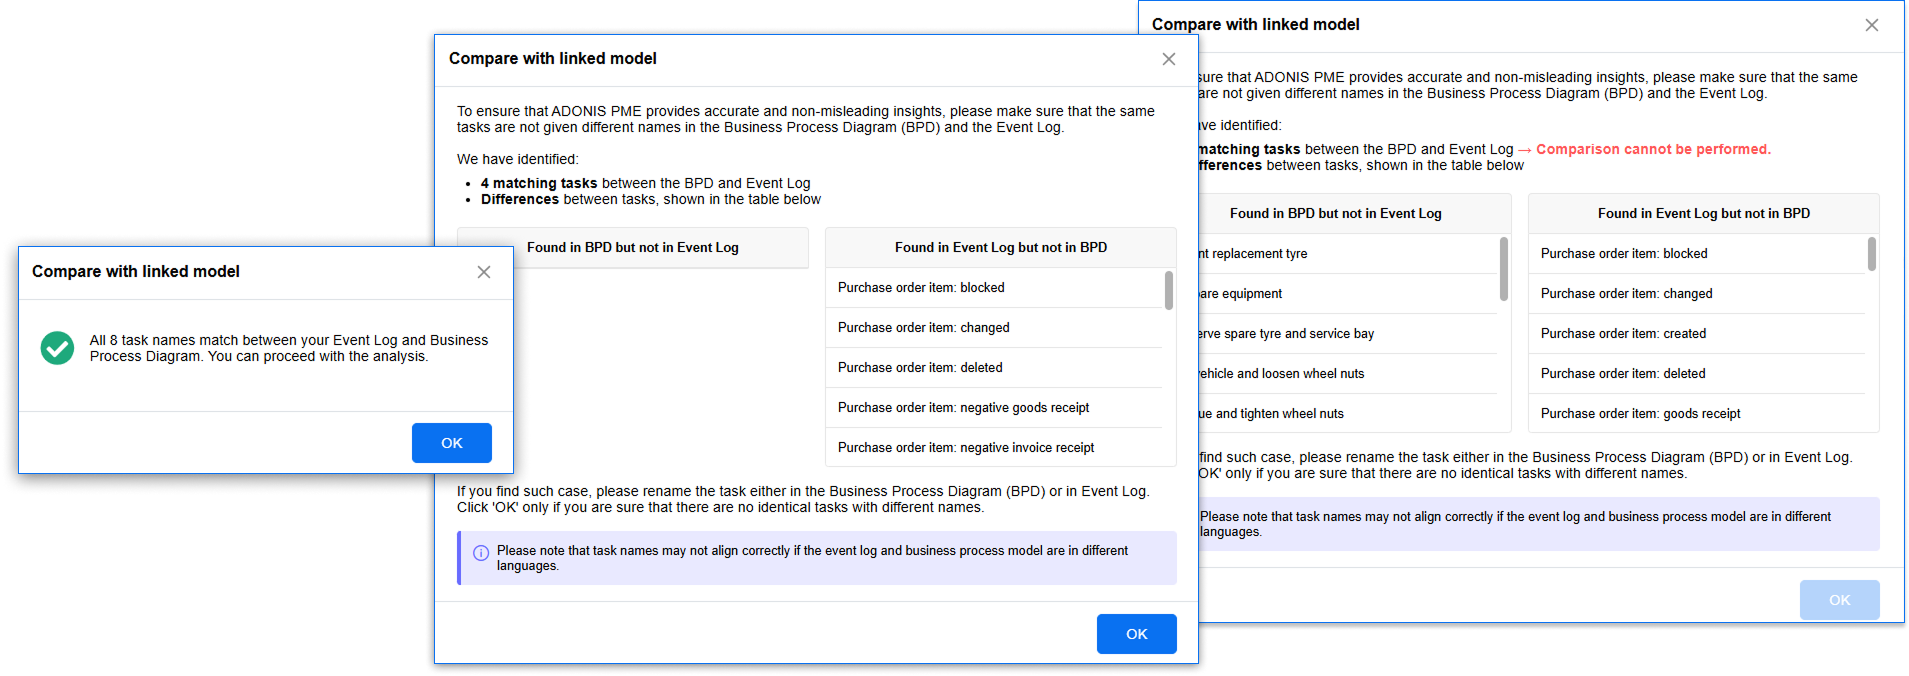
Depending on the degree of conformity, the following results are possible:
All task names match
This is the ideal basis for comparison. Click OK to proceed with the analysis.Some tasks match
The dialog shows the number of matching tasks (for example, "22 matching tasks between the BPD and the event log") and lists the differences in a table with the following columns:Found in BPD but not in Event Log
Found in Event Log but not in BPD
You can proceed by clicking OK, but the results may be inaccurate or misleading. To ensure reliable results, close the dialogue and rename the listed tasks either in the linked model or in the event log so that all task names match. Then set up the comparison with the linked model again.
No matching tasks
The dialogue shows the differences between tasks in a table. Since no identical tasks exist in the linked model and the event log, the comparison cannot be performed.Close the dialogue and verify that the correct model is linked. If necessary, rename the listed tasks either in the linked model or in the event log so that all task names match, and then set up the comparison again.
Conformant and non-conformant cases
Shows the total number of cases within the selected time period, and how many of them match (or deviate from) the calculated process model:
Conformant cases follow the expected sequence of activities without deviations, demonstrating compliance with the intended workflow.
Non-conformant cases deviate from the expected sequence or structure.
This metric helps identify compliance issues, bottlenecks, and areas where the process can be improved.
Conformance rate
This metric (ratio between the number of conformant cases and the number of all cases) refers to the degree to which the actual execution of a process conforms to the predefined or expected process model. It is a measure of how closely the real-world process matches the designed process flow. A high conformance rate indicates that the process is being executed as intended, while a low conformance rate suggests deviations or inefficiencies that may need to be addressed. This metric helps in identifying compliance issues, bottlenecks, and areas for process improvement.
Event log fitness
This metric measures how well the entire event log (which includes all recorded activities across cases) fits or corresponds to the process model. It is generally a log-level metric and looks at the fitness of the whole log, not just individual cases. Fitness is calculated by comparing the observed event sequences in the log against the model's possible sequences and transitions. A high event log fitness score means the event log can be fully explained by the process model, while a low score suggests that the model cannot adequately represent the observed events or that significant deviations from the model exist in the log.
Average case fitness
This metric calculates the fitness of the process model for each individual case and then averages these fitness scores across all cases. It is a per-case metric, meaning each process instance is evaluated independently, and the average of all cases' fitness scores is taken. The fitness for each case is usually based on how well its specific activity sequence fits the predefined model's transitions. A high average case fitness indicates that, on average, most cases follow the expected process model closely. If the average fitness is low, it suggests that many individual cases deviate significantly from the model, even if some cases conform perfectly.
Average case fitness over time
This chart shows how the average fitness of individual process cases changes over a specified time period. It tracks the average degree to which each case conforms to the predefined process model across time intervals. This chart helps identify trends or shifts in case compliance over time and can highlight periods when cases are more or less aligned with the model. A drop in average case fitness could indicate emerging deviations or issues that need to be addressed.
Conformant cases over time
This chart shows how the conformance rate of cases changes over the specified time period. It helps identify trends, such as periods when conformance improves or deteriorates, allowing for insights into process stability, compliance, and performance over time. If the rate drops, it can indicate emerging issues or deviations that need further investigation.
Top 5 violations
This metric displays the top five violations found during conformance checking. Violations refer to deviations or non-compliance with the predefined process model, where the actual behaviour observed in the event log diverges from the expected process flow. These violations can manifest in various forms, such as activities occurring out of sequence, missing or extra activities, or invalid transitions. Violations provide insights into where and how the process execution is inconsistent with the intended design. They highlight areas of inefficiency, risk, or non-compliance, and can serve as signals for process improvement or corrective actions.